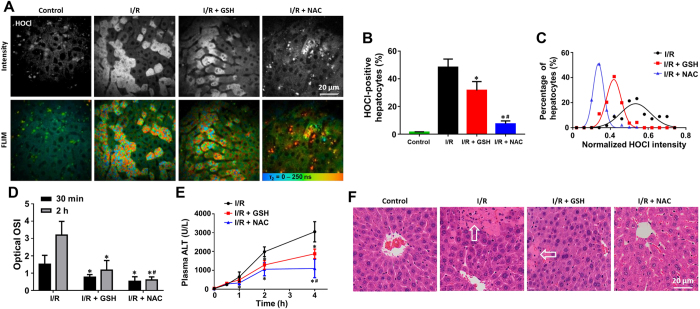
Figure 6. Quantitative in vivo detection of different responses to GSH and NAC treatment against hepatic I/R injury.
(A) Representative fluorescence intensity and FLIM images of cellular HOCl of the control, I/R, I/R + GSH, and I/R + NAC groups at 30 min after reperfusion. All images were recorded at λExc/λEm: 850/515 to 620 nm. Scale bar: 20 μm. (B) The percentages of HOCl-positive hepatocytes in all groups. (C) Population density modeling of the mean HOCl intensity per cell in the I/R, I/R + GSH, and I/R + NAC groups. (D) Optical OSI of the liver at 30 min and 2 hours after reperfusion. (E) Concentration-time profile of ALT levels in peripheral blood of the I/R, I/R + GSH, and I/R + NAC groups. (F) Representative histology (H&E staining) of the liver of all groups at 4 hours after reperfusion. Arrows indicate cellular necrosis. Values are the mean ± s.d. for n = 5 mice; *p < 0.05, compared with untreated groups; #p < 0.05, compared with I/R + GSH group.

