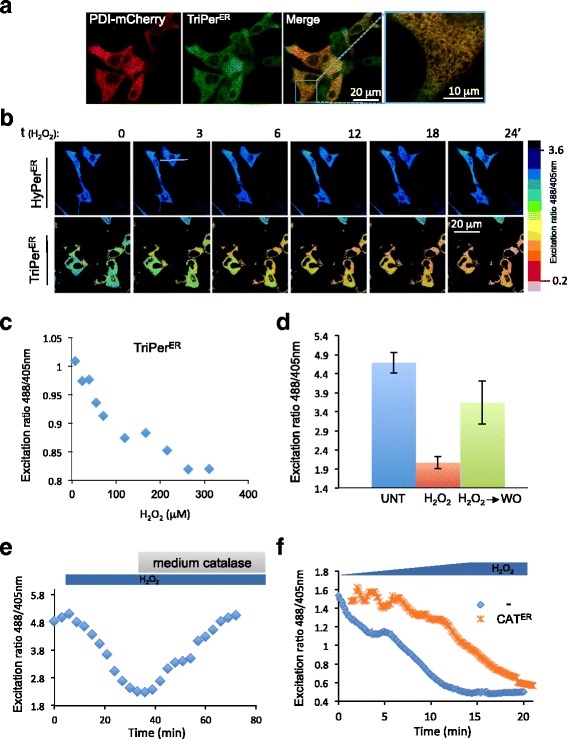
Fig. 4.

ER-localized TriPer responds optically to exogenous H2O2. a Fluorescent photomicrographs of live COS7 cells, co-expressing TriPerER and PDI-mCherry as an ER marker. b Time course of in vivo fluorescence excitation (488/405 nm) ratiometric images (R488/405) of HyPerER or TriPerER from cells exposed to H2O2 (0.2 mM) for the indicated time. The excitation ratio in the images was color coded according to the map shown. c Plot showing the dependence of in vivo fluorescence excitation (488/405 nm) ratio of TriPerER on H2O2 concentration in the culture medium. d Bar diagram of excitation ratio of TriPerER from untreated (UNT) cells, cells exposed to H2O2 (0.2 mM, 15 min), or cells 15 min after washout (H 2 O 2 ➔WO) (mean ± SEM, n = 12). e A ratiometric trace of TriPerER expressed in RINm5F cells exposed to H2O2 (0.2 mM) followed by bovine catalase for the indicated duration. f A ratiometric trace of TriPerER expressed alone or alongside ER catalase (CAT ER) in RINm5F cells exposed to increasing concentrations of H2O2 (0–0.2 mM). Shown are representatives of n ≥ 3
