Fig. 7.

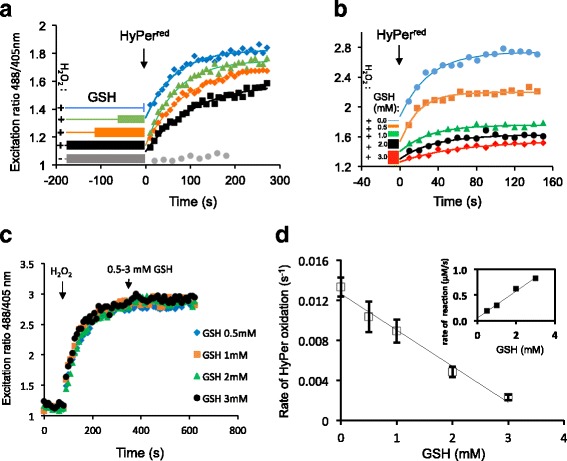
Kinetics of uncatalyzed elimination of H2O2 by reduced glutathione.. a Traces of time-dependent changes to the excitation ratio (R488/405) of recombinant HyPer introduced into a solution of H2O2 (10 μM) that had been preincubated with GSH (3 mM) for increasing time periods, as indicated. Note the inverse relationship between HyPers oxidation rate and the length of the preceding H2O2-GSH preincubation. b As in a but following HyPer introduction into premixed solutions of H2O2 (10 μM) and reduced glutathione (GSH) at the indicated concentrations (0–3 mM). c As in a, but HyPer was exposed sequentially to H2O2 (2 μM) and various concentrations of GSH. d A plot of HyPer oxidation rate (reflecting the residual [H2O2]) as a function of GSH concentration. The slope (–0.0036 s–1 mM–1) and the y-intercept (0.01263 s–1) of the curve were used to extract the dependence of H2O2 consumption rate (–d[H2O2]/dt, at 10 μM H2O2) on each GSH concentration point (0–3 mM) according to Eqs. (2)–(4). The bimolecular rate constant was calculated by division of the slope of the resulting curve (shown in the inset) by the initial [H2O2] (10 μM)
