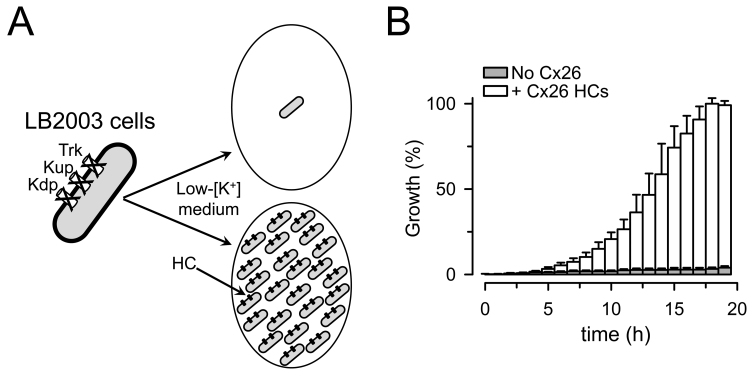
Figure 3.
Growth complementation by expression of Cx26 HCs in LB2003 cells. (a) Schematic representation of the LB2003 cells. (b) Growth complementation by Cx26 shown as percent of the maximal growth in the Cx26-expressing cells. Data are means ± SEM. Adapted from J Biomol Screen [79] with permission from SAGE Publications. See [79] for details.

