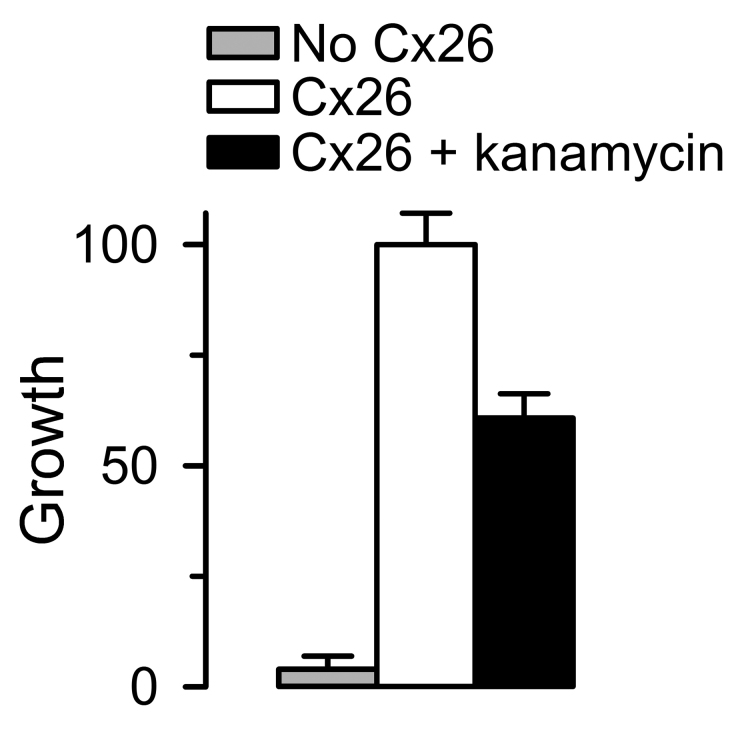
Figure 5.
Evaluation of assay performance. Values are presented as means ± SD of data from multi-well plates from 276 (No Cx26 and Cx26) and 72 (Cx26 + kanamycin) measurements performed in four independent experiments. Growth was normalized to the mean of Cx26-expressing cells under control conditions. The HC inhibitor kanamycin was used at a concentration of 10 µM, which produces ~50 percent inhibition. The calculated Z’ factors for Cx26 vs. No Cx26 and Cx26 + kanamycin A vs. No Cx26 were 0.8 and 0.6, respectively. Adapted from J Biomol Screen [79] with permission from SAGE Publications. See [79] for details.

