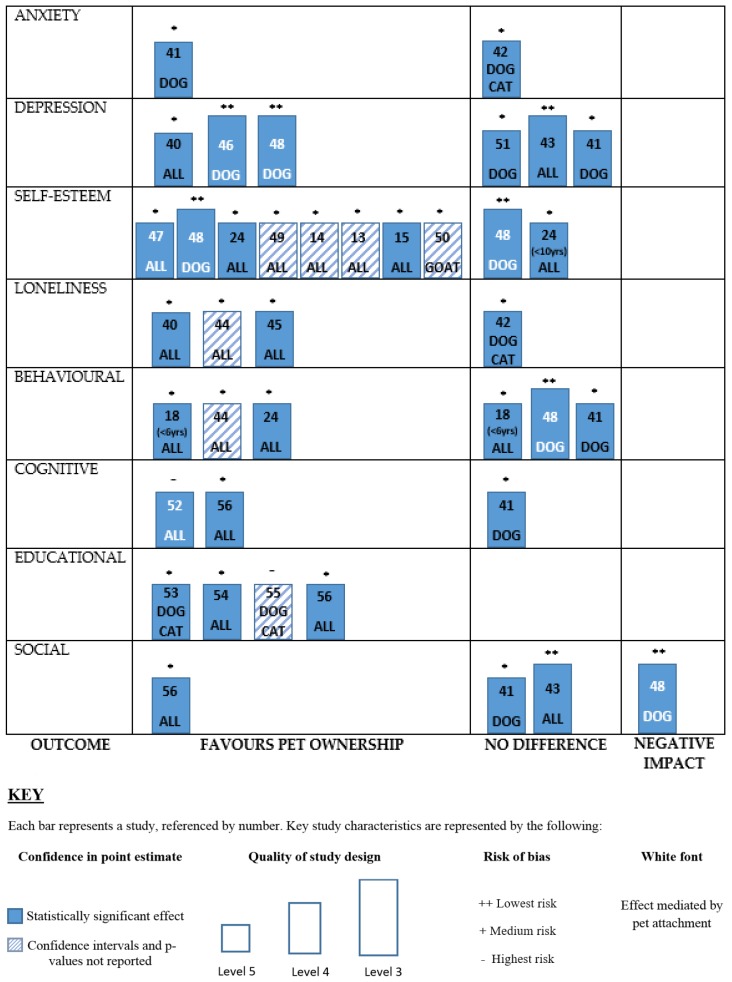
Figure 2.
Harvest plot showing evidence for the impact pets have on categories of child and adolescent development. The table consists of eight rows (one for each dimension of development) and three columns (showing the differential effects of the evidence in each category). Each study is represented by a bar in each row; studies can be identified by reference number. Statistically significant effects (use of p-values) are indicated with solid blue bars, and studies with no confidence intervals and p-values reported are striped bars. The quality of study design is indicated by the height of the bar as categorised by OCEBM level of Evidence 2011. Each bar is annotated with marking to show risk of bias.

