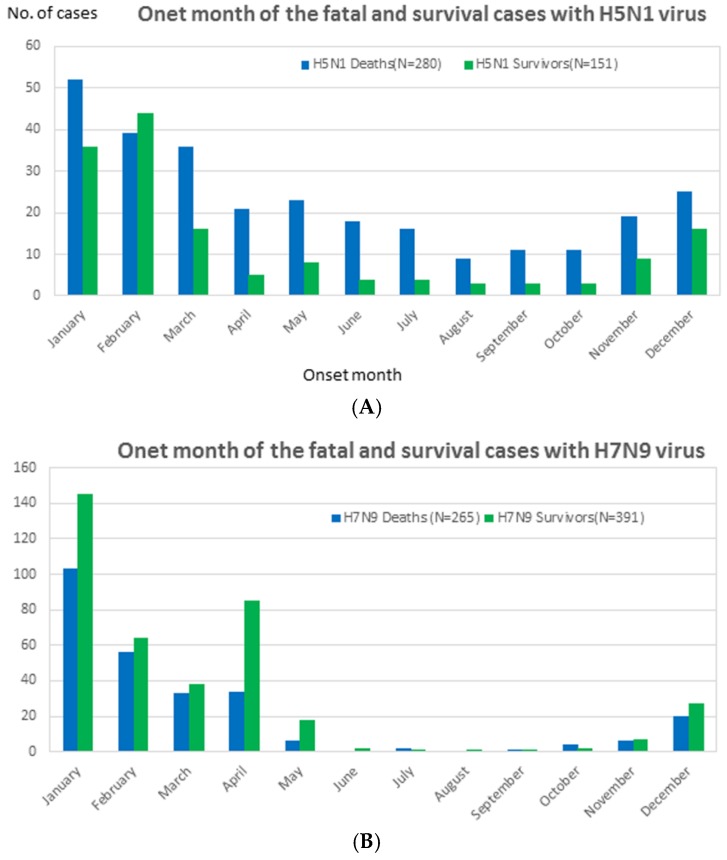
Figure 2.
The onset month distribution of highly pathogenic avian influenza A (H5N1) and low pathogenic A (H7N9) virus fatalities and survivors until November 2016. (A) The onset month distribution of highly pathogenic avian influenza A (H5N1): survivors (N = 280) and deaths (N = 151). (B) The onset month distribution of low pathogenic A (H7N9) viruses: survivors (N = 265) and deaths (N = 391).

