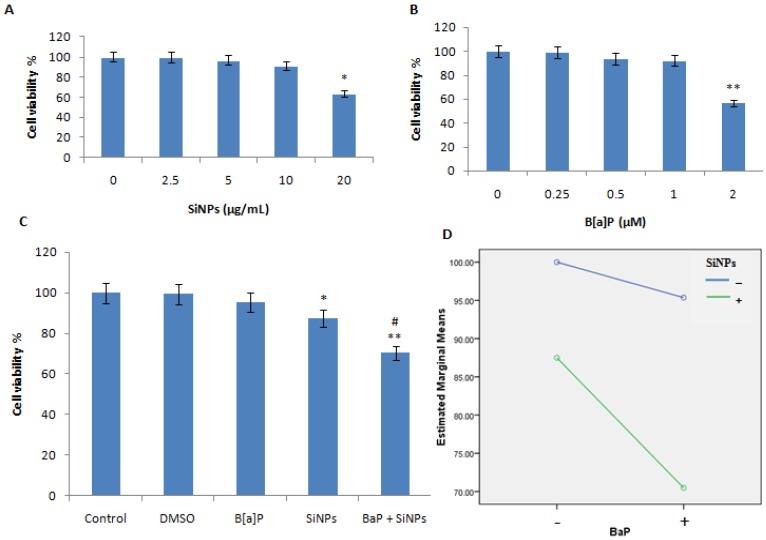
Figure 2.
Effects of SiNPs and/or B[a]P on HUVECs’ viability. (A) Cell viability of various concentrations of SiNPs; (B) Cell viability of various concentrations of B[a]P; (C) Cell viability of HUVECs treated with DMSO (1%), SiNPs (10 μg/mL), B[a]P (1 μM), and their mixture (10 μg/mL + 1 μM); (D) Profile plot shows a synergy interaction between SiNPs and B[a]P (F = 6.476, p = 0.021). * p < 0.05, ** p < 0.01 for treated group compared to control, while # p < 0.05 for combined groups compared to single treated groups.

