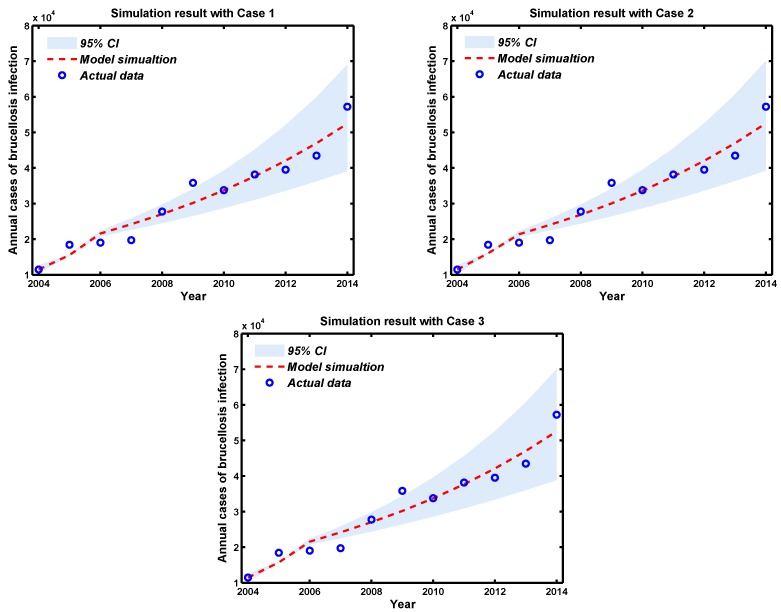
Figure 3.
Brucellosis model fitting for the annual cases of human brucellosis infection with different Cases. The light grey shaded area shows the 95% confident interval (CI) for all 1000 simulations, and the blue circles mark the reported data for human brucellosis cases. Let represent annual cases of brucellosis infection, and , where .

