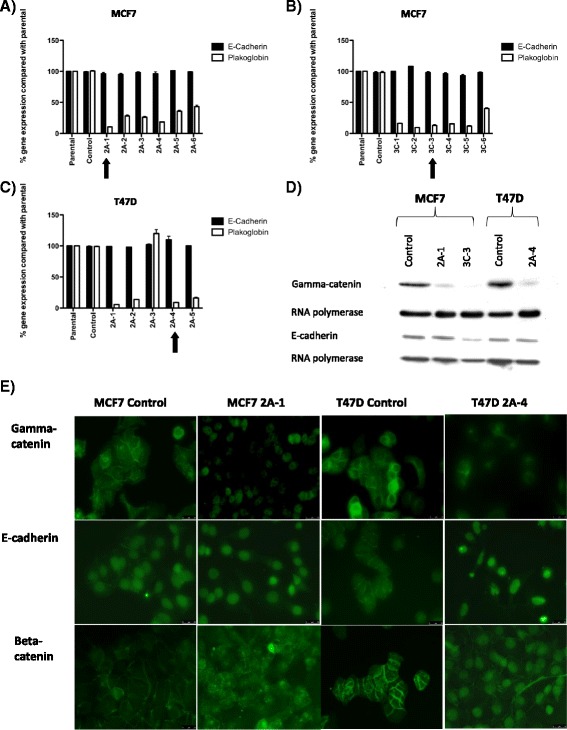
Fig. 2.

Shows relative expression of plakoglobin and e-cadherin compared with GAPDH ± SEM before and after siRNA knockdown with (a) scramble sequence or miRNA cassette 2 in MCF7 cells, (b) scramble sequence or miRNA cassette 3 in MCF7 cells, (c) scramble sequence or miRNA cassette 2 in T47D cells. d Are Western blots showing gamma catenin and E-cadherin expression following transfection with scramble sequence or miRNA cassettes 2 and 3. e Shows immunohistochemical staining for γ-catenin, e-cadherin and beta-catenin (green). In the control cells γ-catenin, e-cadherin and β-catenin are expressed on the cell surface clearly demarcating the cell-cell junctions. In the knock down lines, γ-catenin staining is reduced and e-cadherin and β-catenin is detected in the nucleus and the cytoplasm and β-catenin
