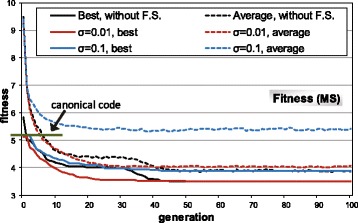
Fig. 4.

MS evolution through generations with the restrictive codes. All graphs are an average of 10 independent GA runs, without fitness sharing and fitness sharing with two values for the parameter σ share (sharing radius). The graph includes the canonical code MS value for comparison (horizontal line)
