
Fig. 9.
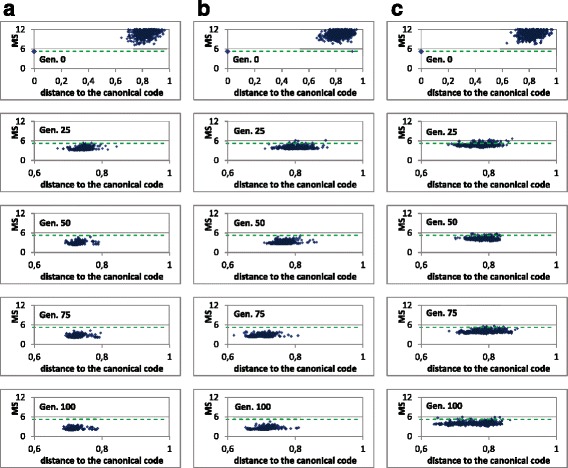
MS value of the genetic population codes vs. their distances to the canonical code. The same graph is shown in different generations of a GA run, in 3 cases with the unrestrictive codes: a without fitness sharing, b fitness sharing with σ share=0.01 and c fitness sharing with σ share=0.1. The canonical code was introduced in the initial population in the 3 cases (point with larger size). The green dashed line represents the MS value of the canonical genetic code