
Fig. 4.
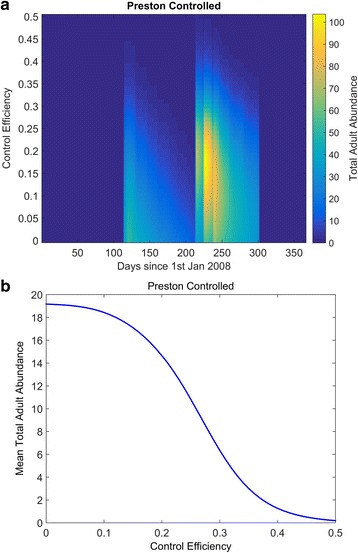
The effects of varying the control efficiency on the adult midge population at Preston. The midge model is run with varying values of control efficiency and the total annual adult (nulliparous and parous) population is plotted, using the graduated colour scale (a). The transect corresponding to when the control efficiency is zero corresponds to the red line in Fig. 3b. In b, the average of the total adult abundances for each value of control efficiency is shown