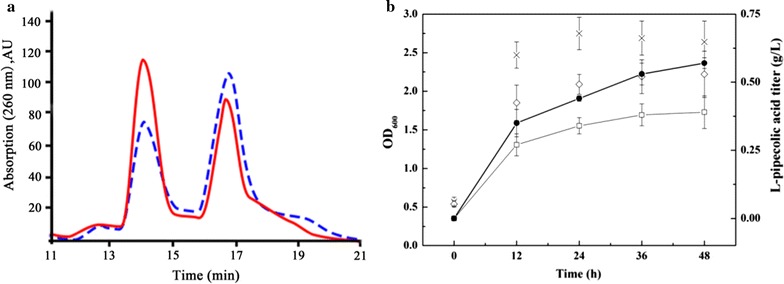
Fig. 4.

Effect of over-expressing PNTs on l-pipecolic acid production. a The HPLC analysis of the NAD+/NADH bound to LCD that over-expressed with PNTs or without PNTs. The red line represents the LCD that over-expressed with PNTs, the blue dashed line represents the LCD that over-expressed without PNTs. The peak at 14.2 min is NAD+ and the peak at 16.9 min is NADH. b The effect of over-expressing PNTs on l-pipecolic acid production. The unfilled square represents l-pipecolic acid titer of strain without over-expressing PNTs, the filled circle represents l-pipecolic acid titer of strain with over-expressing PNTs (g/L); the cross represents OD600 of stain without over-expressing PNTs, the unfilled diamond represents OD600 of stain with over expressing PNTs
