Fig. 5.

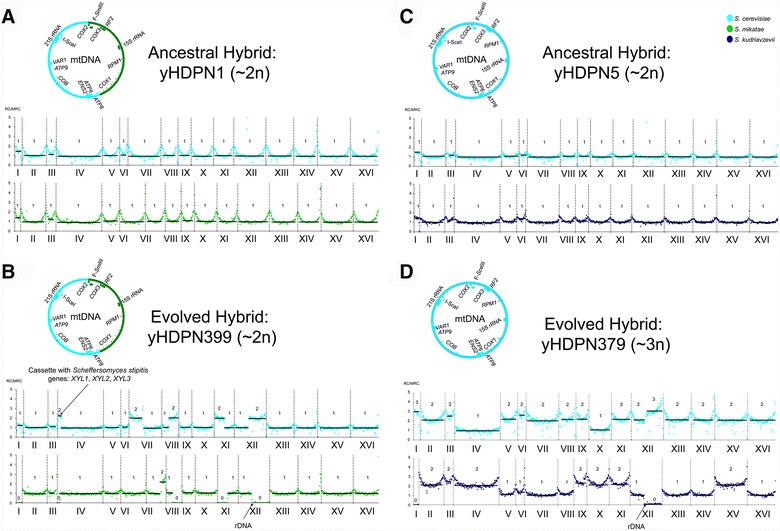
Adaptive evolution drives genome rearrangements during ACSH fermentation at 30 °C. Read coverage levels (RC), normalized using the median value of read coverage (MRC) for the complete genome, are shown for each subgenome of yHDPN1, yHDPN399, yHDPN5, and yHDPN379 in A–D). The levels were adjusted by establishing the lowest average coverage value for one copy. The genomic region where the Sch. stipitis XYL1, XYL2, and XYL3 genes were inserted and the cluster of ribosomal DNA are indicated. Approximate ploidy levels (Additional file 8) and chromosome content are included. Note that, in some libraries, the read mapping against a reference generates a “smiley pattern” where distal regions of chromosomes are better represented than proximal regions, a phenomenon for which chromatin structure may be responsible [99]. Mitochondrial genomes are displayed in circles, and the color corresponds to the species donor, denoted in the legend. Recombination in Y73 × S. mikatae was likely initiated in the COX2 gene, a region previously described as a recombination hotspot due to the presence of the homing endonuclease gene F-SceIII [100]
