Fig. 6.

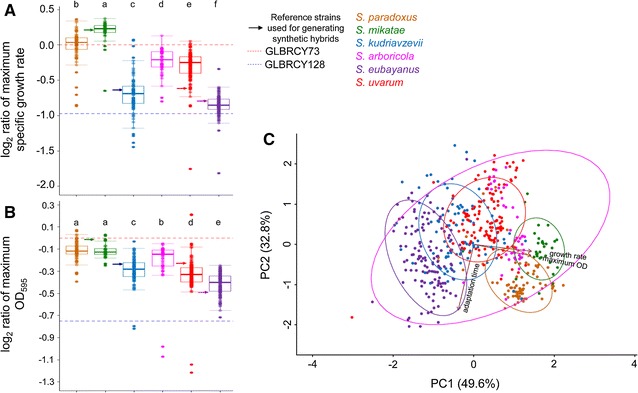
S. mikatae strains have innate tolerance to ACSH. A, B report the average (n = 2) of normalized maximum growth rate (µ, defined as (ln(OD2) − ln(OD1))/(T 2 − T 1)) and maximum OD595 for the 507 wild Saccharomyces strains. Median values for the species are represented by a horizontal line inside the box, and the upper and lower whiskers represent the highest and lowest values of the 1.5 * IQR (inter-quartile range), respectively. By definition, the values for the reference Y73 strain are 0, and values above this threshold are better than the reference. Normalized values for Y128 are represented by dashed blue lines. Letters are Dunn’s test homogeneous groups inferred from pairwise comparisons. Data points and boxplots are colored according to the species designation. Arrows highlight the values for the type strains, which were used to generate the synthetic hybrids. C Principal component analysis (PCA) summarizing three kinetic parameters for the wild Saccharomyces strains is shown. PC1 and PC2 accounted for 49.6 and 32.8% of the variation, respectively. Color dots represent the values for each Saccharomyces strain according to the legend. Circles indicate the clustering based on species designation. Variable weights are represented by brown arrows
