
Fig. 4.
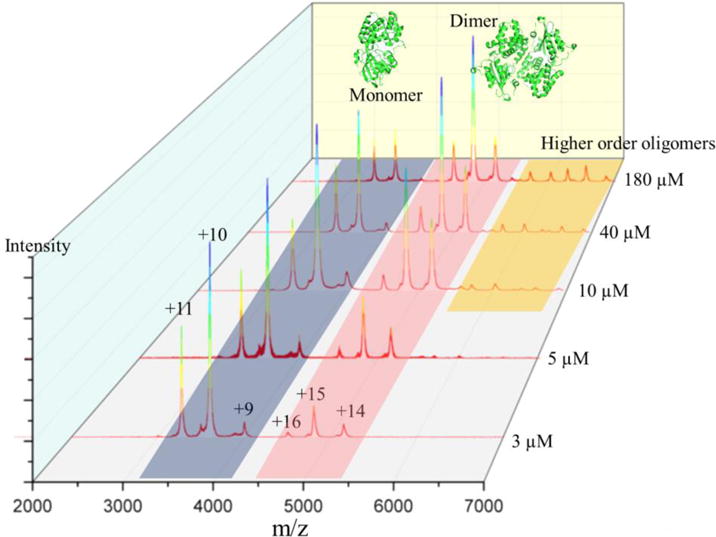
Native mass spectrum of OCP diluted to concentrations of 180, 40, 10, 5, and 3 μM. Structure of monomeric and dimeric OCP are shown as PDB 1M98.
Official websites use .gov
A
.gov website belongs to an official
government organization in the United States.
Secure .gov websites use HTTPS
A lock (
) or https:// means you've safely
connected to the .gov website. Share sensitive
information only on official, secure websites.
Native mass spectrum of OCP diluted to concentrations of 180, 40, 10, 5, and 3 μM. Structure of monomeric and dimeric OCP are shown as PDB 1M98.