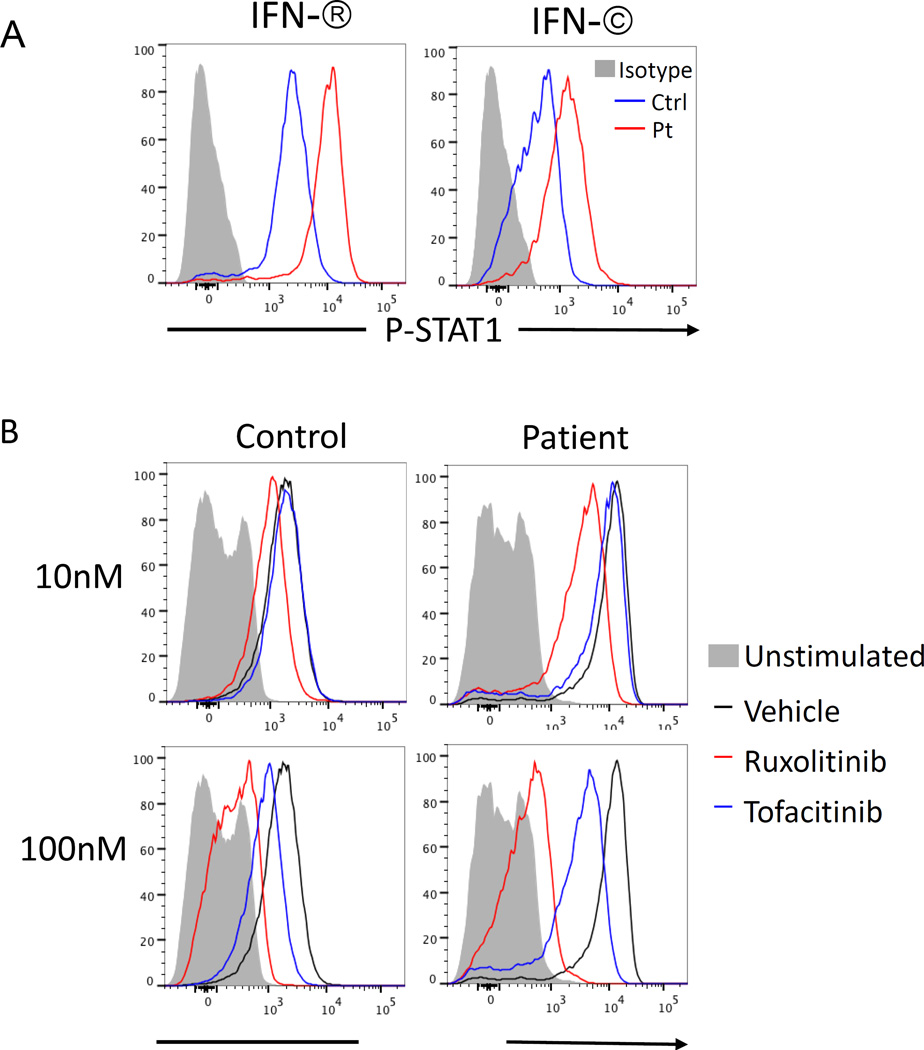
Figure 3.
A) Phospho-STAT1 expression in CD4+ T cells stimulated with IFN-β (20 ng/mL) and IFN-γ (20 ng/mL) in a patient with STAT1 GOF mutation and in a healthy control. B) Phospho-STAT1 expression upon IFN-β (20ng/mL) stimulation in CD4+ T cells from control and STAT1 (E545K) patient pretreated for 4 hours with 10nM and 100nM concentrations of ruxolitinib (red line histogram) and tofacitinib (blue line histogram) or vehicle (DMSO, black lie histogram). Gray solid histogram corresponds to unstimulated cells (from ref. 43).

