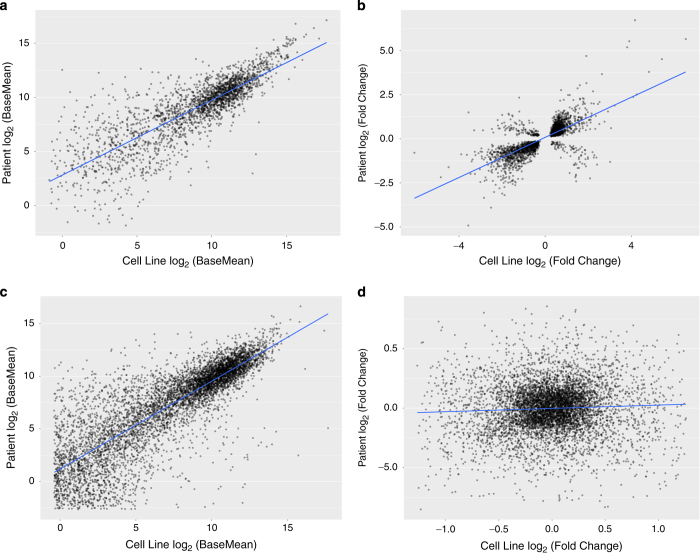
Figure 3. Concordance of differentially-expressed genes between neuroblastoma cell lines and primary tumors.
(a) Across the neuroblastoma cell lines, 3,940 genes were differentially-expressed (DE) based on MYCN amplification status and of those, 2,395 were differentially-expressed based on MYCN amplification status in primary tumors and were significantly correlated (Pearson’s R=0.824, P<2.2 e-16). (b) The fold changes of these DE genes were significantly correlated between the cell line dataset and the patient tumor dataset (Pearson’s R=0.73, P<2.2 e-16). (c) A significant correlation between the common 6,523 genes that were not DE in cell lines and tumors was observed (Pearson’s R=0.829, P<2.2 e-16). (d) As expected, correlation of the non-DE genes’ fold changes was close to zero (Pearson’s R=0.052, P<3 e-5).

