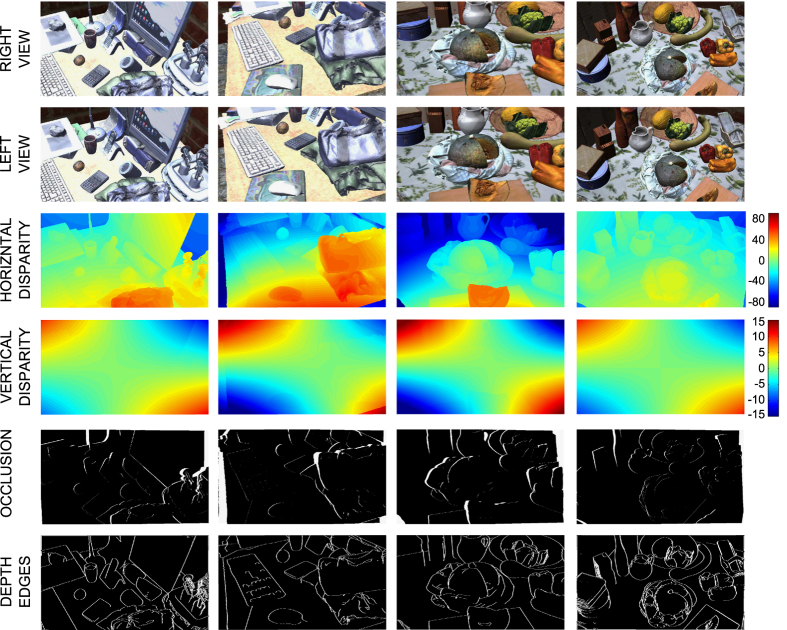
Figure 7. Example of stereoscopic pairs from the dataset, including, from top to bottom, the left and right views, the horizontal and vertical ground-truth disparity maps, and the occlusion and edge maps.
In the disparity maps, reported in pixel, hot colors represent crossed horizontal disparity and right-hyper vertical disparity, whereas blue colors represent uncrossed horizontal disparities and left-hyper vertical disparities, according to the colorbars on the right.

