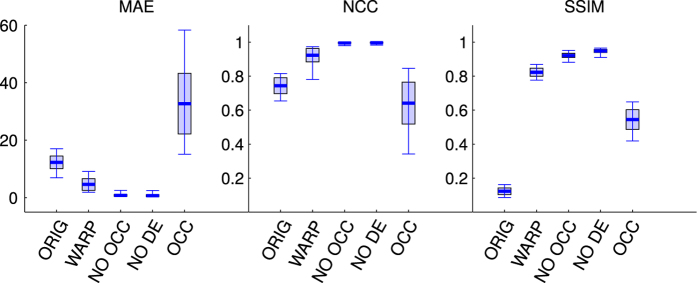
Figure 8. Disparity reconstruction error, computed on three different stereo quality indexes over the whole dataset, and represented as median value (horizontal thick line), first and third quartile (rectangle) and range (whiskers).
Three different indexes are represented, from left to right: the Mean Absolute Error (MAE9,70), the Normalized Cross Correlation (NCC9) and the Structure Similarity Index (SSIM68,69). Each index has been computed for the original stereo pair (ORIG), not considering the occluded areas (NO OCC), not considering both the occluded areas and the depth edges (NO DE), and finally considering only the pixels corresponding to the occluded areas and the depth edges (OCC).

