. 2016 Dec 19;8(3):2396–2400. doi: 10.1039/c6sc04664a

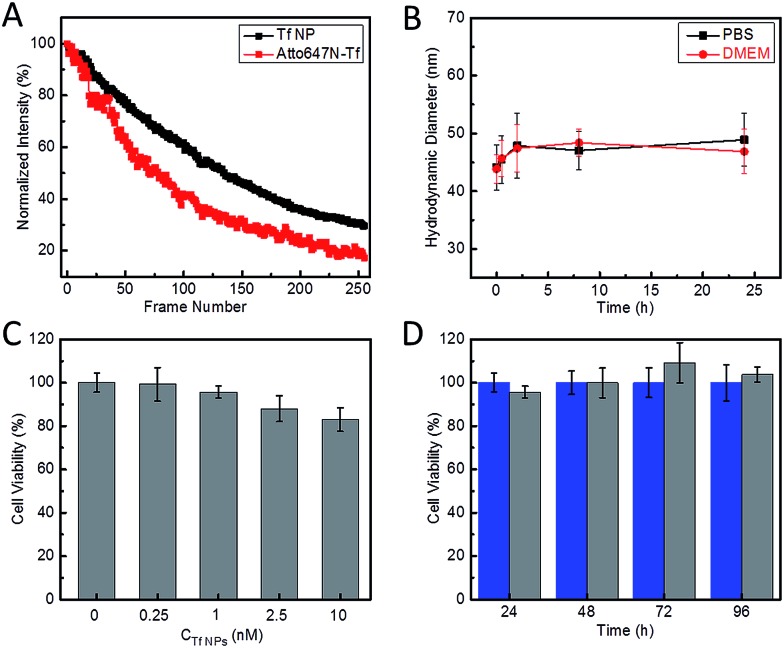
Fig. 2. Characterization of the photostability and biocompatibility of Atto647N–Tf NPs. (A) Average fluorescence intensity plotted against the number of image frames upon repeated scanning of Atto647N–Tf NPs (black) and Atto647N–Tf (red) immobilized on glass surfaces, with 780 nm STED laser pulses of 28 mW at the sample and pixel dwell time of 40 μs. (B) Hydrodynamic diameter of Atto647N–Tf NPs in PBS and DMEM, measured by DLS, as a function of incubation time. (C) Viability of HeLa cells after 24 h incubation with different concentrations of Atto647N–Tf NPs, determined by a MTT assay. (D) Viability of HeLa cells after incubation with 1 nM Atto647N–Tf NPs (grey) compared with control samples (blue) over a period of three days, determined by a MTT assay. The error bars represent standard deviations among four independent measurements.

Fig. 2