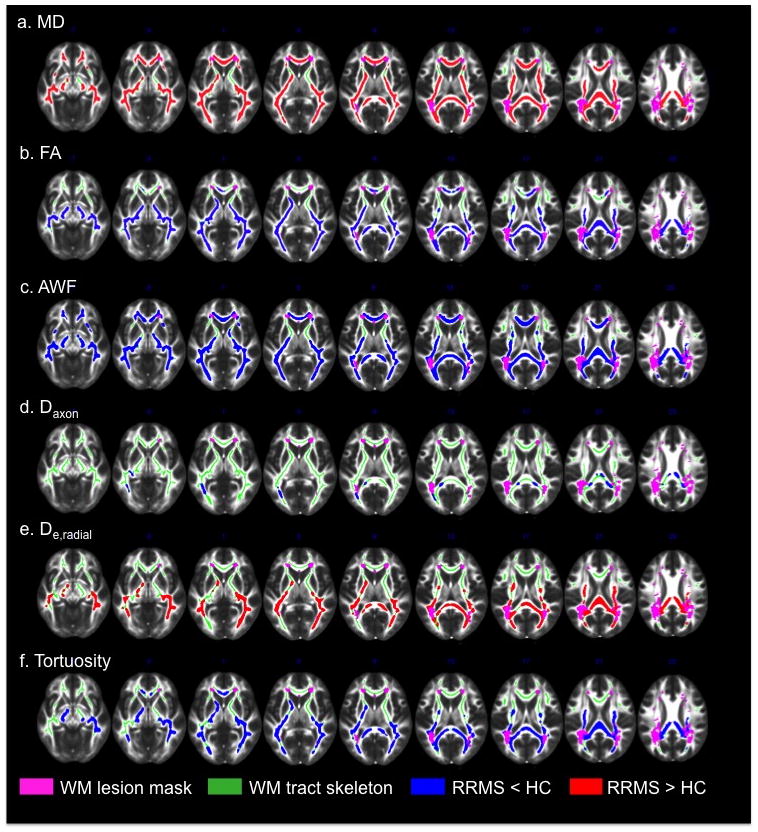
Fig. 2.

TBSS results showing statistically significant differences between RRMS and HC for the WMTI metrics of FA (a), MD (b), AWF (c), Daxon (d), De,radial (e), and tortuosity (f). Clusters of voxels with significantly increased values (two-sided P < .05) in RRMS compared to HC (red), and significantly decreased values (blue) are overlaid on the FMRIB FA template together with the mean NAWM skeleton (green) and the lesion probability map (thresholded at > .1; pink)
