Fig. 3.

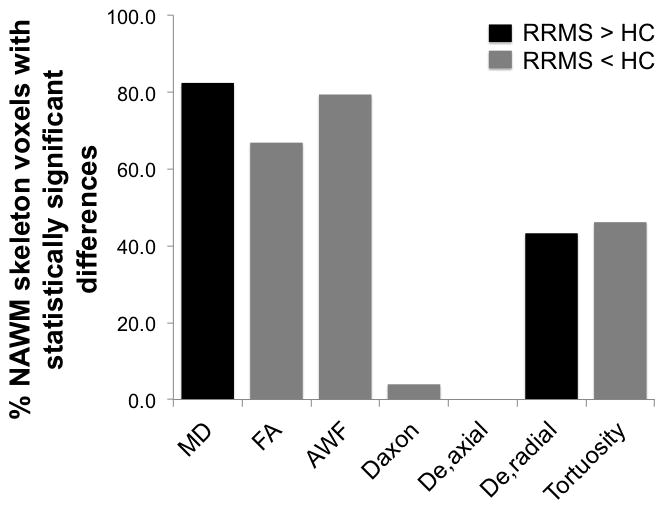
Bar graph representation of the percentage of NAWM skeleton voxels in RRMS patients with a statistically significant increase (black) or decrease (gray) in FA, MD, and WMTI metrics compared to HC

Bar graph representation of the percentage of NAWM skeleton voxels in RRMS patients with a statistically significant increase (black) or decrease (gray) in FA, MD, and WMTI metrics compared to HC