Abstract
Photoacoustic (PA) imaging is an emerging technology that combines structural and functional imaging of tissues using laser and ultrasound energy. We evaluated the ability of PA imaging system to measure real-time systemic and microvascular mean oxygen saturation (mSAO2) in a rat model of hypoxic shock. Male Sprague Dawley rats (n = 6) underwent femoral artery catherization and were subjected to acute hypoxia by lowering the fraction of inspired oxygen (FiO2) from 1.0 to 0.21, and then to 0.08. PA measurements of mSaO2 were taken in the femoral artery near the catheter tip using the Vevo 2100 LAZR at each FiO2 and compared to co-oximetry on blood removed from the femoral catheter. Both co-oximetry and PA imaging measured a similar stepwise decline in femoral artery mSaO2 as FiO2 was lowered. We also measured mSaO2 in the feed arteriole of the rat spinotrapezius muscle and adjacent microvessels (n = 6) using PA imaging. A significant decrease in mSaO2 in both the feed arteriole and adjacent microvessels was recorded as FiO2 was decreased from 1.0 to 0.08. Moreover, we detected a rapid return toward baseline mSaO2 in the feed arteriole and microvessels when FiO2 was increased from 0.08 to 1.0. Thus, PA imaging is noninvasive imaging modality that can accurately measure real-time oxygen saturation in the macro and microcirculation during acute hypoxia. This proof-of-concept study is a first step in establishing PA imaging as an investigational tool in critical illness.
Keywords: Co-oximetry, femoral artery, hypoxia, microcirculation, photoacoustic imaging, rat spinotrapezius muscle, shock, ultrasound, Vevo LAZR 2100
INTRODUCTION
Shock is state of global hypoperfusion and tissue hypoxia, which boasts a mortality approaching 90% in the absence of timely diagnosis and aggressive intervention (1). Unfortunately, shock is not easily detected in its early stages and many patients suffer poor outcomes due to delays in diagnosis (2). Much of the current shock research is directed at diagnostic modalities that estimate tissue oxygenation as a means to detect early hypoperfusion. However, these diagnostic strategies are either poorly sensitive for detecting early shock due to a reliance on surrogate markers for tissue hypoxia, or invasive with significant risks (3, 4). At present, there is no rapid, noninvasive, and direct means to measure macro and microvessel oxygenation in multiple organ systems in critically ill patients.
Photoacoustic (PA) imaging is a technology that combines ultrasound and laser energy to simultaneously evaluate tissue structure and function (5). Nonionizing laser pulses are absorbed by tissue, which creates a thermoelastic expansion. This expansion produces mechanical energy in the form of ultrasound waves that can be detected by conventional ultrasound transducers to form images (Fig. 1). PA has several advantages over x-ray, ultrasound, and optical imaging methodologies. First, PA imaging does not pose health hazards from ionizing radiation like x-rays. In addition, it provides better resolution than optical imaging modalities at depths greater than 1 mm due to less optical scattering. PA imaging also provides better contrast than ultrasound imaging (6). Finally, PA imaging can take advantage of the differing optical absorption spectra of oxy- and deoxyhemoglobin to provide in vivo functional measurement of oxygen saturation, hemoglobin concentration, and the distribution of biomarkers (7, 8).
Fig. 1. Schematic of the Vevo 2100LAZR device with solid vertical lines indicating ultrasound signals to and from the transducer, yellow arrows indicating pulsed laser energy to tissues, and red arrows indicating a PA signal from the tissues back to the transducer.
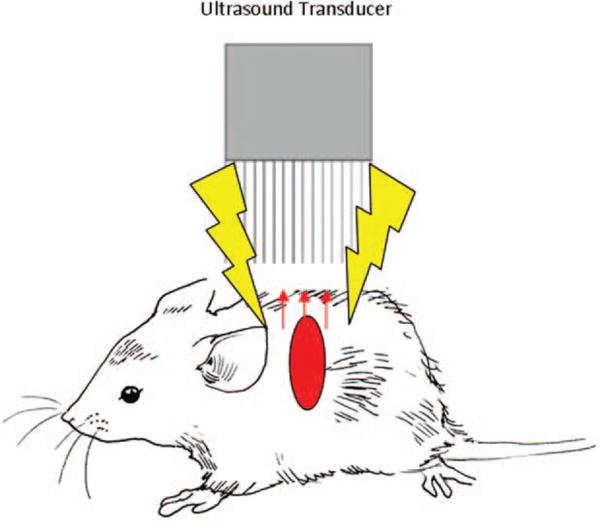
PA indicates photoacoustic.
VisualSonics has developed a preclinical PA imaging system known as the Vevo 2100 LAZR, which is capable of making oxygenation measurements in various small vascular beds (9). This device has the ability to coregister B-Mode and PA signals. It has already demonstrated usefulness for imaging tumor models and other chronic diseases (10). Our study shows that PA imaging can be used for real-time measurement of macro and microvessel hemoglobin oxygen saturation during hypoxic shock in rodents. It is rapidly sensitive to changes in oxygen saturation caused by variations in the fraction of inspired oxygen (FiO2). Our proof-of-concept study suggests that PA imaging could be a useful diagnostic modality in critically ill patients to detect occult shock and target organ hypoxia once this technology is brought to the bedside.
MATERIALS AND METHODS
Male Sprague Dawley rats (Charles River, Raleigh, NC) between 8 and 10 weeks of age and weighing 280 to 350g were used for this study. Large vessel oxygenation was measured in the femoral artery of Sprague Dawley rats (N = 6). Oxygen saturation was also measured in the spinotrapezius muscle of an additional group of six rats. Animals used in the study followed the National Institutes of Health’s Guidelines for the Humane Treatment of Laboratory Animals. The Wake Forest School of Medicine Institutional Animal Care and Use Committee approved this protocol.
Femoral artery oxygen saturation
Anesthesia was induced with isoflurane (5%, balance oxygen) in a standard induction chamber with a gas vaporizer (Harvard Apparatus, Holliston, MA), and maintained at 2% (balance oxygen) administered via nose cone. The hair was removed over the neck and left femoral region using shaving and a depilatory agent. The left femoral artery and jugular vein were isolated and cannulated with PE-20 tubing. Ringer solution was infused through the jugular catheter at a rate of 1 mL kg−1 h−1 to prevent dehydration. The animals were then transferred to the Vevo 2100 LAZR viewing platform (VisualSonics Inc, Toronto, ON, Canada), which was heated to 37°C and continuously monitored the animal’s heart and respiratory rate.
Once on the platform, the animals were allowed to equilibrate for 5 min while inhaling 100% oxygen in from a nose cone. Warmed ultrasound gel (37°C) was applied to the femoral region. The long and short axis of the femoral artery was identified using standard, two-dimensional B-mode ultrasound just proximal to the tip of the arterial catheter with the Vevo 2100 LAZR LZ250 high-frequency transducer. Arterial blood flow was confirmed with pulse Doppler and Doppler color flow imaging. PA images were generated after light from the laser (750 and 850nm wavelengths) was delivered to the vessel and surrounding tissue at 20 Hz repetition rate, 5 nm pulse width, 6 to 8 ns pulse duration, and 20 mJ peak pulse energy. Propagated PA waves were acquired by the transducer array, coregistered with B-mode images, and saved to the device hard drive. Calculation of mean arterial oxygen saturation (mSaO2) was accomplished with the Vevo software (HemoMeazure and OxyZated, Visual Sonics Inc, Toronto, ON, Canada) by selecting a 0.25 mm2 area of vessel with PA signal just proximal to the tip of the arterial catheter. Immediately after PA imaging, a 0.25 mL sample of arterial blood was withdrawn from the femoral artery catheter for measurement of arterial oxygen saturation by co-oximetry and routine blood gas analysis using a Radiometer ABL (model 80FLEX Co-Ox; Brea, CA).
The animals had their FiO2 lowered to 0.21 and 0.08 in a stepwise manner, and then returned to 1.0. At each step, the animals were allowed to equilibrate for 5 min followed by PA determination of femoral artery mSaO2 near the catheter tip and blood sampling for co-oximetry.
Spinotrapezius small vessel and microvessel oxygenation
Anesthesia was induced with isoflurane (5%, balance oxygen) in a standard induction chamber and maintained at 2% (balance oxygen) via nose cone. Jugular catheters were placed for intravenous hydration. The hair over the back was removed using shaving and a depilatory agent. The animals were transferred to the Vevo viewing platform, which was heated to 37°C and used to continuously monitor the heart rate. Warmed ultrasound gel was applied to the back and the region of the left spinotrapezius muscle was imaged in long and short axis using the LZ250 high frequency transducer. A 0.1 mm2 area overlaying the feed arteriole (confirmed with pulse Doppler and Doppler color flow imaging) was selected for mSaO2 measurement. A second area of tissue measuring 0.25 mm2 that was adjacent (<0.1mm distance) to the feed arteriole was selected to determine microvessel mSaO2. PA images were generated using the device, settings, and software as previously described. A baseline measurement of mSaO2 was made after a 5-min equilibration period on 1.0 FiO2. The FiO2 was then lowered in a stepwise manner to 0.21 and 0.08 before returning to 1.0. A 5-min equilibration period was allowed at each step before measuring mSaO2 in the vessel and tissue areas. The time needed to return small vessel mSaO2 to within 10% of baseline after increasing FiO from 0.08 to 1.0 was recorded.
Statistical analysis
Data is presented as mean ± SD unless otherwise noted. Single comparisons between two independent means were made using Student t test, whereas one- and two-way analysis of variance were performed on multiple comparisons of means using the Prism GraphPad data analysis software (GraphPad Software Inc, La Jolla, CA). A Bonferroni correction was applied on multiple comparisons of means. Significant differences were determined at the P <0.05 level.
RESULTS
Large vessel oxygen saturation
A total of six SD rats were evaluated in this study with a mean weight of 251 ± 20 g. There was no difference in resting heart rate, femoral artery pulse wave velocity, or temperature at the start of the procedure. Figure 2 is a sample image of the rat spinotrapezius in both standard, two-dimensional B mode ultrasound and PA formats under conditions of high FiO2.
Fig. 2. Sample B Mode (A) and PA (B) images of the rat spinotrapezius muscle while breathing a high FiO2.
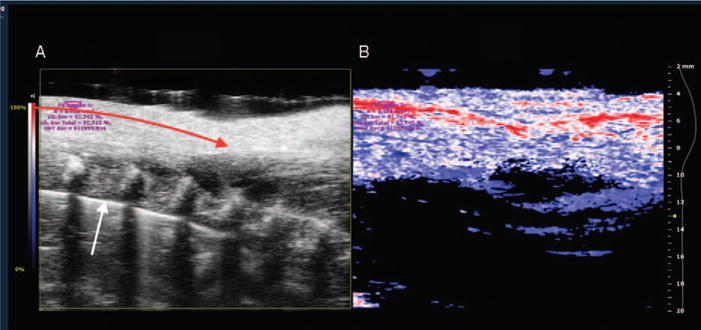
A, B mode image shows a linear portion of the feed arteriole (red arrow) and vertebral bodies (white arrow). B, PA images with color scaling to show areas of high oxygen saturation along the arteriole in red and low saturation in blue. Purple letters indicate calculations of oxygen saturation and hemoglobin concentration in selected window (purple circle). PA indicates photoacoustic.
Table 1 and Figure 3 show a stepwise decline in arterial PO2 and hemoglobin saturation as FiO2 was lowered from 1.0 to 0.08. Both co-oximetry and PA imaging methods of measurement demonstrated a significant decrease in oxygen saturation as FiO2 was lowered from 1.0 to 0.21 (P <0.05), and again from 0.21 to 0.08 (P <0.01). There was no difference between mSaO2 measured by the Vevo 2100 LAZR and co-oximetry performed on femoral artery blood samples at FiO2 1.0 (P = 0.453), 0.21 (P = 0.584), or 0.08 (P = 0.564).
Table 1.
Values (mean ± standard deviation) of femoral artery PO2 at decreasing FiO2 measured with co-oximeter on blood taken from femoral catheter (n = 6)
| FiO2 | Femoral artery PO2 |
|---|---|
| 1.0 | 110±12 |
| 0.21 | 92±8 |
| 0.08 | 49±13* |
Asterisks indicate significant differences in PO2 at 1.0 FiO2 and values for PO2 measured at lower FiO2.
Fig. 3. Femoral artery SaO2 ± standard deviation versus stepwise decrease in FiO2 (n = 6 animals).
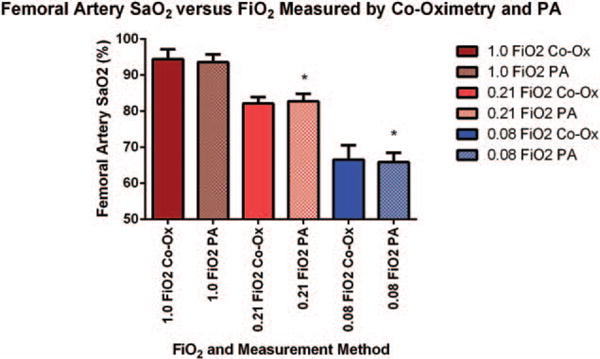
Measurements were made by conventional co-oximetry on blood taken from femoral artery catheters (solid bars) or measured by PA imaging (hashed bars) on a 0.25 mm2 area over the femoral artery. Asterisks indicate significant differences in SaO2 measured by PA imaging at 1.0 FiO2 and values for SaO2 measured at lower FiO2.
Small vessel and microvessel oxygen saturation
A total of six SD rats were evaluated in this portion of the study with a mean weight of 265 ± 15 g. There were no differences in resting heart rate or temperature at the start of this procedure.
Figure 4 shows a significant decline in PA-measured mSaO2 in the feed arteriole as FiO2 was decreased from 1.0 to 0.08 (P <0.05). In addition, there was an immediate and significant increase in small vessel mSaO2 when FiO2 was increased from 0.08 back to a baseline of 1.0 (P <0.001). The mean time for mSaO2 to return to within 10% of baseline was 30 ± 6 s.
Fig. 4. Mean spinotrapezius arteriole mSaO2 ± standard deviation measured by PA imaging versus stepwise decrease in FiO2 followed by a return to high FiO2 (n = 6 animals).
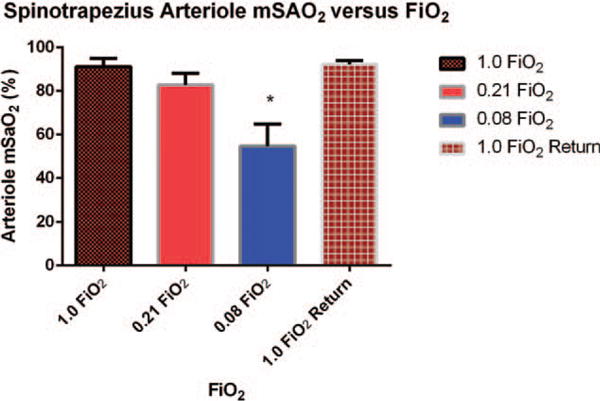
Measurements were made on a 0.1 mm2 area of tissue overlying a feed arteriole. Asterisks indicate significant differences in SaO2 measured by PA imaging at 1.0 FiO2 and values for SaO2 measured at lower FiO2.
There was also a stepwise and significant decline (P <0.05) in microvessel mSaO2 as FiO2 was decreased from a baseline of 1.0 to 0.21, and then to 0.08 (Fig. 5). Comparison of Figures 4 and 5 reveals that baseline values for mSaO2 in microvessels adjacent to the feed arteriole were lower than those obtained in the feed arteriole at FiO2 of 1.0 (P <0.05) with values in the feed arteriole measuring 91.2 ± 3.8% and values in adjacent microvessel measuring 80.9 ± 3.3%. This trend continued with microvessel mSaO2 being lower than arteriole levels at each step as FiO2 was lowered (P <0.05). Moreover, microvessel mSaO2 did increase after the FiO2 was restored back to 1.0, but never completely returned to baseline (P <0.05).
Fig. 5. Mean spinotrapezius microvessel mSaO2 ± standard deviation measured by PA imaging versus stepwise decrease in FiO2 followed by a return to high FiO2 (n = 6 animals).
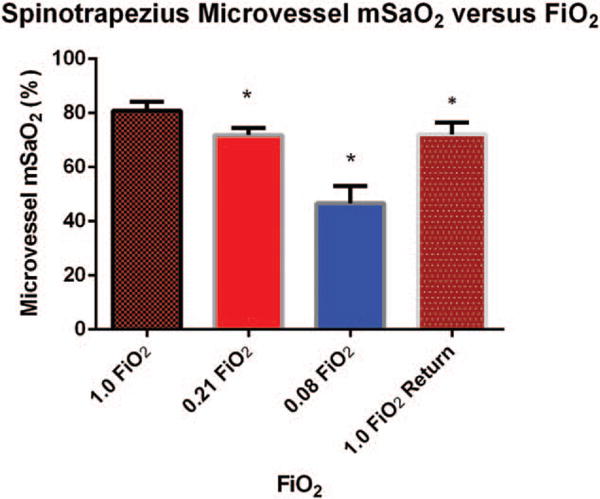
Measurements were made on a 0.1 mm2 area of tissue adjacent to the feed arteriole. Asterisks indicate significant differences in SaO2 measured by PA imaging at 1.0 FiO2 and values for SaO2 measured at lower FiO2.
DISCUSSION
Our findings support the hypothesis that PA imaging is a reliable and noninvasive method to detect real-time, in vivo hypoxia in a rodent model of hypoxic shock. We found good agreement between PA imaging determination of mSaO2 and conventional methods of measuring oxygen saturation from blood samples. In addition, the Vevo 2100 LAZR was effective at measuring oxygen saturation in large, small, and skeletal microvessels across a wide range of FiO2.
Figures 2 and 3 demonstrate the ability of PA imaging to deliver structural and functional information during hypoxic shock. There was no difference in oxygen saturation measured by PA imaging or conventional co-oximetry performed on blood taken from the femoral artery. In addition, the decline in mSaO2 as FiO2 was decreased corresponding to an appropriate drop in arterial PO2 (Table 1), which corroborates the data obtained with the two optical methods of measuring oxygen saturation. Our findings are consistent with previous ex vivo PA measurements of mSaO2 performed on blood taken from the tail vein of mice after inhalation of various concentrations of oxygen (9). Our validation step reinforces an advantage of PA imaging over conventional methods in that it is noninvasive and obviates the need for arterial puncture for reliable oxygen saturation measurements at a wide range of values.
In addition, PA imaging was effective at measuring oxygen saturation in small vessels and skeletal muscle microvessels as seen in Figures 4 and 5. Baseline measurements of femoral artery and spinotrapezius arteriole SaO2 were similar at high FiO2 and room air when measured with the Vevo 2100 LAZR (Figs. 3 and 4). On the other hand, we found that microvessel oxygen saturation measurements taken adjacent to feed arterioles were lower than those taken directly on the vessels even at high FiO2. This is because microvessel measurements represent averaged oxygen saturation in an area of tissue composed of highly saturated arterioles as well as venules and capillaries having lower oxygen saturation. Our results are consistent with previous studies showing a non-linear fall in microvessel and tissue PO2 with distance away secondary arterioles in various tissues including the spinotrapezius muscle (11, 12).
The Vevo 2100 LAZR was very effective at monitoring real-time changes in large and microvessel oxygen saturation. For example, small vessel mSaO2 had returned to near-baseline levels within 30 ± 6 s when FiO2 was increased from 0.08 to a baseline of 1.0. Interestingly, microvessel oxygen saturation failed to completely recover in the 5-min equilibration period after FiO2 was restored from 0.08 to 1.0. This is likely due to the vasoconstriction that is seen in the skeletal muscle arteriole microcirculation in response to severe hypoxia (13). This vasoconstriction causes profound reductions in oxygen delivery, and it stands to reason that a prolonged recovery period is needed to return microvessel oxygen saturation to baseline levels.
A major strength of this technology is the ability to measure organ-specific oxygen saturation, hemoglobin concentration, and blood flow. Previous studies using a model of hemorrhagic shock have demonstrated that sentinel organs such as the mesentery reach a state of supply-dependent oxygen consumption (i.e., occult shock) before the insult is clinically apparent on a whole-body level (14). In addition, certain disease states such as hypertension accentuate target organ vulnerability to shock from hemorrhage or hypoxia (13). We expect PA imaging to be particularly useful in detecting occult shock since it can be used to provide early organ-specific hemodynamic information in vascular beds such as the mesentery, kidney, heart, and brain.
There are limitations in translating PA imaging from preclinical to bedside applications. First, a lightproof enclosure is needed to block ambient light for accurate PA measurements and exposure to the laser can be damaging to the retina. Second, preclinical PA imaging devices typically use a high-frequency linear array probe that is optimized for image resolution in small rodents rather than the depth needed for large animal and human studies. We found this to be true even for rats where measurements on deep (>10mm) vessels such as the carotid artery were more difficult than those on superficial vessels such as the femoral artery. The imaging system is also large, immobile, and sensitive to animal movement, which does not lend itself to critical care applications where patients are often too sick to be moved.
Despite these limitations, future advances in transducer technology, PA contrast agents, and nanoparticles will bring this technology to the forefront of preclinical functional imaging. Our proof-of-concept study is a first step in testing its potential as an investigational tool in critical illness. Additional studies are underway to determine the research and diagnostic utility of PA imaging in cardiac ischemia, cerebral vascular disease, and shock states other than hypoxia.
Acknowledgments
The authors are grateful to Andrew Heinmiller, Lindsey Hughes, and the other VisualSonics employees who provided training for their work.
Funding for this work was provided by a grant from the Hypertension and Vascular and Research Center at Wake Forest School of Medicine (to Lane Smith) and in part by the NICHD 1R21HD086357-01 (to Liliya M. Yamaleyeva).
References
- 1.Lebella A, Junag P, Reichley R, Micek S, Hoffmann J, Hoban A, Hampton N, Kollef M. The determinants of hospital mortality among patients with septic shock receiving appropriate initial antibiotic treatment. Crit Care Med. 2012;40:2016–2021. doi: 10.1097/CCM.0b013e318250aa72. [DOI] [PubMed] [Google Scholar]
- 2.Kumar A, Roberts D, Woods KE, Light B, Parrillo JE, Sharma S, Suppes R, Feinstein D, Zanotti S, Taiberg L, et al. Duration of hypotension before initiation of effective antimicrobial therapy is the critical determinant of survival in human septic shock. Crit Care Med. 2006;34:1589–1590. doi: 10.1097/01.CCM.0000217961.75225.E9. [DOI] [PubMed] [Google Scholar]
- 3.Mikkelsen ME, Miltiades AN, Gaieski DF, Goyal M, Fuchs BD, Shah CV, Bellamy SL, Christie JD. Serum lactate is associated with mortality in severe sepsis independent of organ failure and shock. Crit Care Med. 2009;37:1670–1677. doi: 10.1097/CCM.0b013e31819fcf68. [DOI] [PubMed] [Google Scholar]
- 4.Shah MR, Hasselblad V, Stevenson LW, Binanay C, O’Connor CM, Sopko G, Califf RM. Impact of the pulmonary artery catheter in critically ill patients: meta-analysis of randomized clinical trials. JAMA. 2005;294:1664–1670. doi: 10.1001/jama.294.13.1664. [DOI] [PubMed] [Google Scholar]
- 5.Kruger RA. Photoacoustic ultrasound. Med Phys. 1994;21:127–131. doi: 10.1118/1.597367. [DOI] [PubMed] [Google Scholar]
- 6.Su JL, Wang B, Wilson KE, Bayer CL, Chen YS, Kim S, Homan KA, Emelianov SY. Advances in clinical and biomedical applications of photoacoustic imaging. Expert Opin Med Diagn. 2010;4:497–510. doi: 10.1517/17530059.2010.529127. [DOI] [PMC free article] [PubMed] [Google Scholar]
- 7.Mallidi S, Larson T, Tam J, Joshi PP, Karpiouk A, Sokolov K, Emelianov S. Multiwavelength photoacoustic imaging and plasmon resonance coupling of gold nanoparticles for selective detection of cancer. Nano Lett. 2009;9:2825–2831. doi: 10.1021/nl802929u. [DOI] [PMC free article] [PubMed] [Google Scholar]
- 8.Hu S, Wang LV. Photoacoustic imaging and characterization of the microvasculature. J Biomed Opt. 2010;15:011101. doi: 10.1117/1.3281673. [DOI] [PMC free article] [PubMed] [Google Scholar]
- 9.Ephrat P, Needles A, Bilan C, Bilan C, Trujillo A, Theodoropoulos C, Hirson D, Foster S. White paper: imaging of murine tumors using the Vevo LAZR photoacoustic imaging system. Available at: http://www.visualsonics.com/sites/default/files/WP_2100_Cb_Photoacoustic_Imaging.pdf. Accessed 2013.
- 10.Laufer J, Johnson P, Zhang E, Treeby B, Cox B, Pedley B, Beard P. In vivo preclinical photoacoustic imaging of tumor vasculature development and therapy. J Biomed Opt. 2012;17:056016. doi: 10.1117/1.JBO.17.5.056016. [DOI] [PubMed] [Google Scholar]
- 11.Tsai AG, Friesenecker B, Mazzoni MC, Kerger H, Buerk DG, Johnson PC, Intaglietta M. Microvascular and tissue oxygen gradients in the rat mesentery. Proc Natl Acad Sci USA. 1998;95:6590–6595. doi: 10.1073/pnas.95.12.6590. [DOI] [PMC free article] [PubMed] [Google Scholar]
- 12.Smith LM, Golub AS, Pittman RN. Interstitial PO (2) determination by phosphorescence quenching microscopy. Microcirculation. 2002;9:389–395. doi: 10.1038/sj.mn.7800147. [DOI] [PubMed] [Google Scholar]
- 13.Smith LM, Barbee RW, Ward KR, Pittman RN. Decreased supply-dependent oxygen consumption in the skeletal muscle of the spontaneously hypertensive rat during acute hypoxia. Shock. 2006;25:618–624. doi: 10.1097/01.shk.0000209548.14424.53. [DOI] [PubMed] [Google Scholar]
- 14.Nelson DP, King CE, Dodd SL, Schumacker PT, Cain SM. Systemic and intestinal limits of O2 extraction in the dog. J Appl Physiol. 1987;63:387–394. doi: 10.1152/jappl.1987.63.1.387. [DOI] [PubMed] [Google Scholar]


