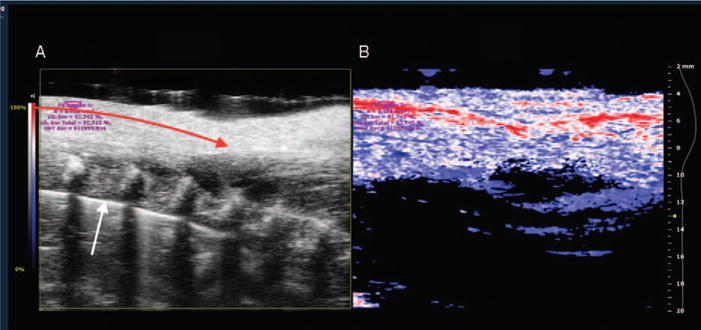
Fig. 2. Sample B Mode (A) and PA (B) images of the rat spinotrapezius muscle while breathing a high FiO2.

A, B mode image shows a linear portion of the feed arteriole (red arrow) and vertebral bodies (white arrow). B, PA images with color scaling to show areas of high oxygen saturation along the arteriole in red and low saturation in blue. Purple letters indicate calculations of oxygen saturation and hemoglobin concentration in selected window (purple circle). PA indicates photoacoustic.
