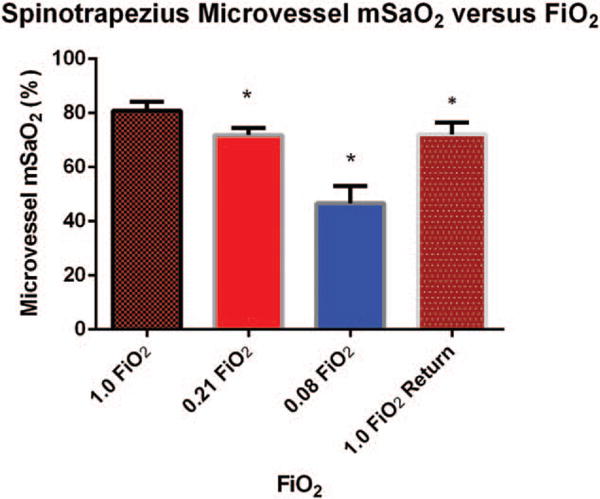
Fig. 5. Mean spinotrapezius microvessel mSaO2 ± standard deviation measured by PA imaging versus stepwise decrease in FiO2 followed by a return to high FiO2 (n = 6 animals).

Measurements were made on a 0.1 mm2 area of tissue adjacent to the feed arteriole. Asterisks indicate significant differences in SaO2 measured by PA imaging at 1.0 FiO2 and values for SaO2 measured at lower FiO2.
