. 2016 Oct 3;8(2):1243–1250. doi: 10.1039/c6sc02486f

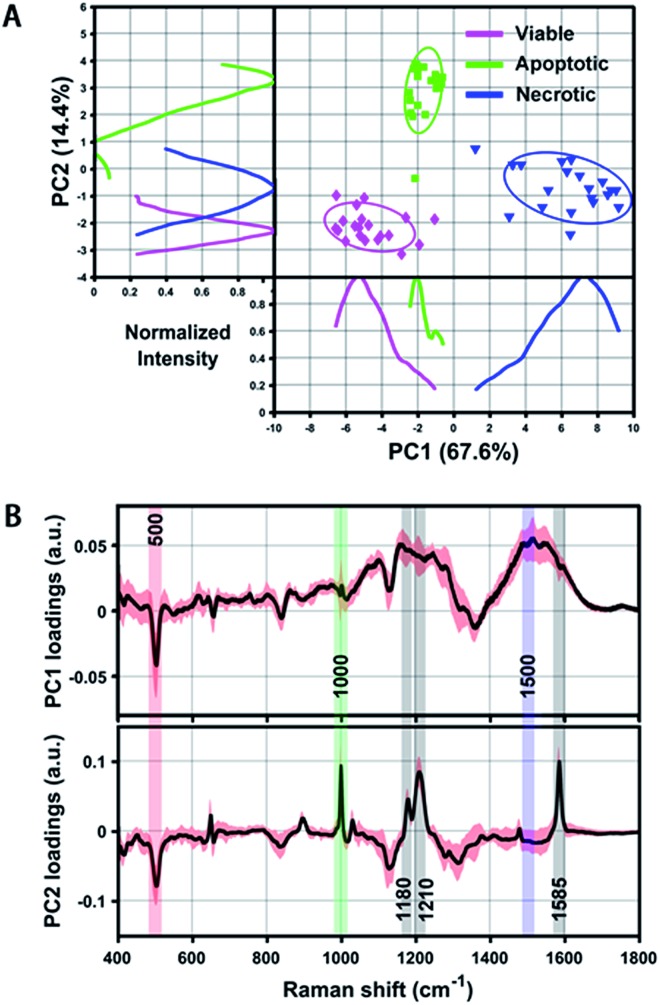
Fig. 3. (A) Scatter plot and 1D intensity distribution of PC1 vs. PC2 scores originating from the PERS spectra of reference viable, apoptotic and necrotic cell samples. Different cell populations are clearly segregated by either the scatter plot or 1D intensity line of the PCs. Intensity curves were generated by using Kernel density estimation to smooth PC score histograms. (B) PC1 and PC2 loading of all extracted spectra of the above three reference samples, which shows distinct peaks corresponding to the discrimination weight between these cell groups at a certain Raman shift. The averaged PCs from 20 spectra are shown as a black line and their standard deviation is highlighted in red.

Fig. 3