. 2016 Sep 26;8(2):1105–1115. doi: 10.1039/c6sc02925f

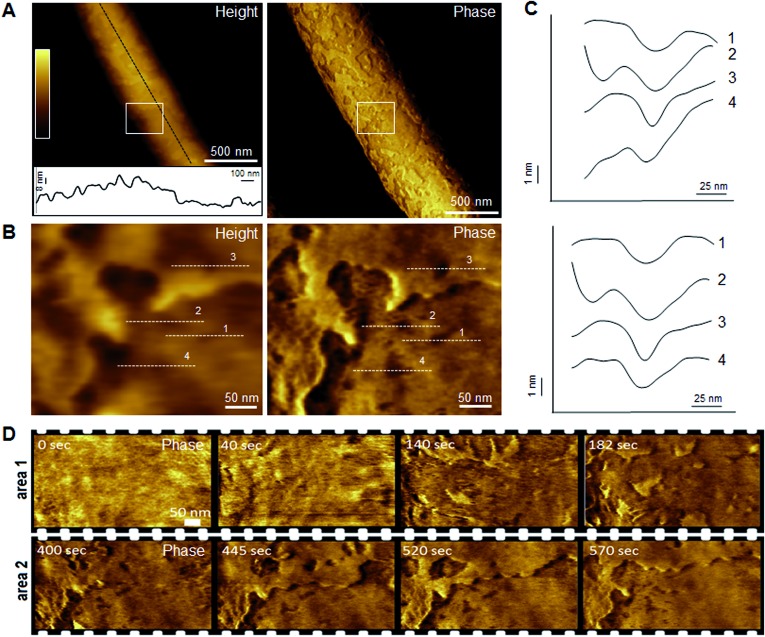
Fig. 3. Monolayer poration and progressive membrane removal in live bacteria. (A) Topographic (height) and phase AFM images of live E. coli in water taken at the first 780 s incubation with tilamin. Inset in height image: a height profile taken along the black dotted line on the back of the bacterium, showing 8 nm-deep steps from the outer cell-wall layer to the inner membrane. The outer layer includes the outer membrane (3.7–4.1 nm)23 and a periplasmic peptidoglycan layer (4 nm). (B) High resolution topographic and phase images of the areas marked by white boxes in (A), after correction for background curvature in the height data (see ESI). These images show exfoliation of the outer membrane and poration in both outer and inner membrane. (C) Height profiles taken along the highlighted lines in (B) (top), and after additional local background subtraction (bottom). These data show the depth profiles of individual pores. (D) High resolution phase images of E. coli during incubation with tilamin, as a function of time (for the corresponding height images, see Fig. S2). Two different areas are shown. Time-point labels indicate time since injection. Colour scale for height data, see (A) 140 nm (A) and 19 nm (B). Incubation conditions: 3.5 μM, pH 7.4, room temperature (rt).

Fig. 3