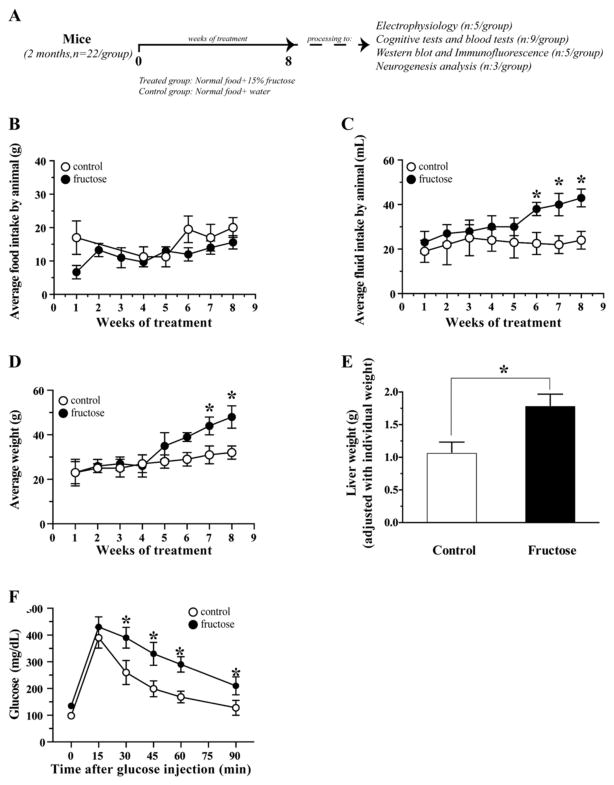
Fig. 1.
Establishment of like-MetS condition. (A) Representative model of the induction of MetS in mice. (B) Average food intake during the 8 weeks of treatment. (C) Water of fructose intake during the treatment time. (D) Average weight of control and treated group. (E) Liver weight in the treated animals (F) Glucose tolerance test by 90 min after glucose injection. The values are expressed as the means ± SEM of n, *p < 0.05 based on ANOVA (one-way) followed by Bonferroni post hoc analysis.

