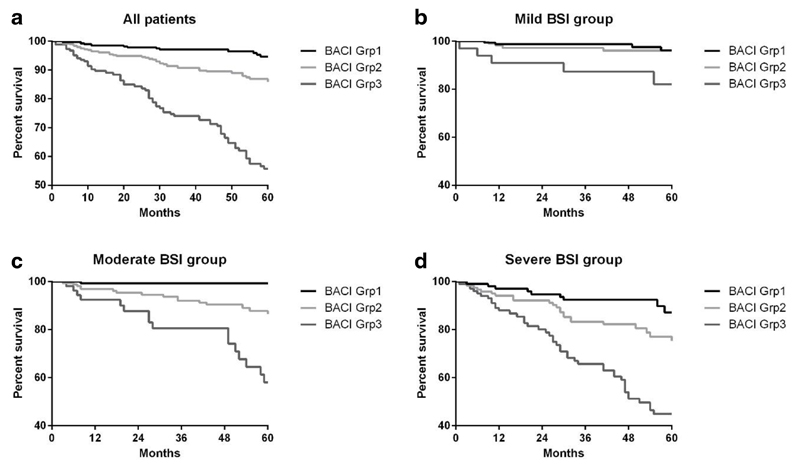
Figure 4.
Kaplan-Meier survival curves representing survival probability at 5 years. (a) Kaplan-Meier survival curve according to the Bronchiectasis Severity Index (BSI) with mild (0-4 points), moderate (5-8 points) and severe (≥ 9 points). To demonstrate the predictive contribution of the Bronchiectasis Aetiology Comorbidity Index (BACI) to the BSI, the survival curves were represented for each BSI tertile (b) mild disease, (c) moderate disease, and (d) severe disease. BACI group 1 = score of O, BACI group 2 = score <6, BACI group 3 = score ≥ 6. Survival is significantly lower in BACI groups 2 and 3 compared to group 1 which represents no high risk comorbidities. The gap between groups becomes much more evident as disease severity increases.

