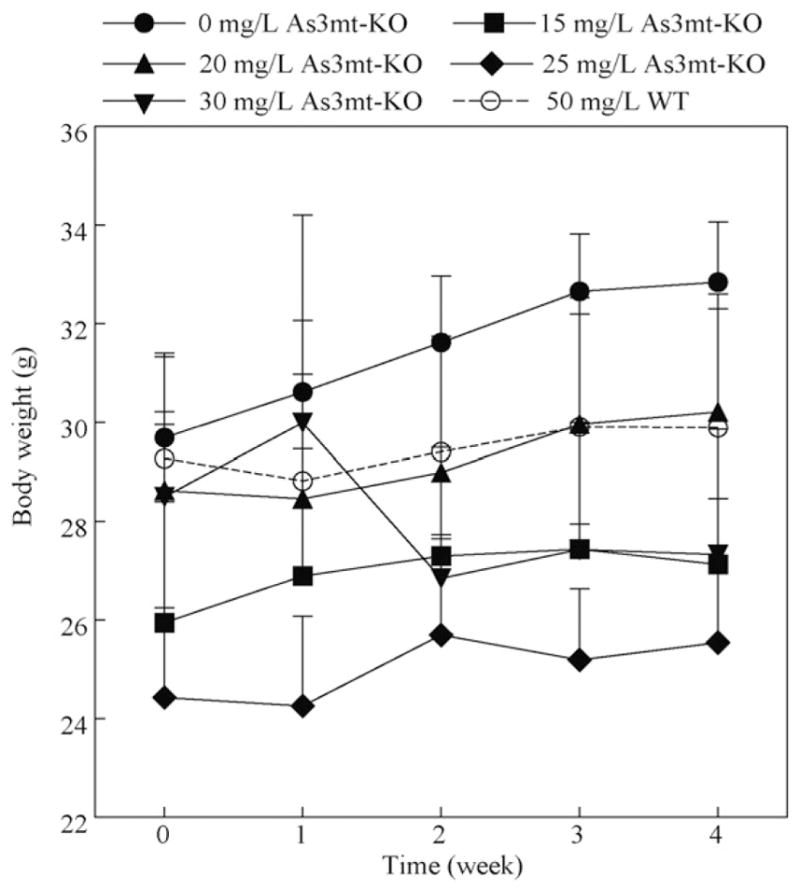
Fig. 2.

Change in body weights of As3mt-KO mice exposed to 0, 15, 20, 25, or 30 mg/L As and WT mice exposed to 50 mg/L As. Mean and SD, n = 5 for each of the As3mt-KO group and n = 10 for the WT group. There were no statistically significant differences in weekly average weights between the treatment groups.
