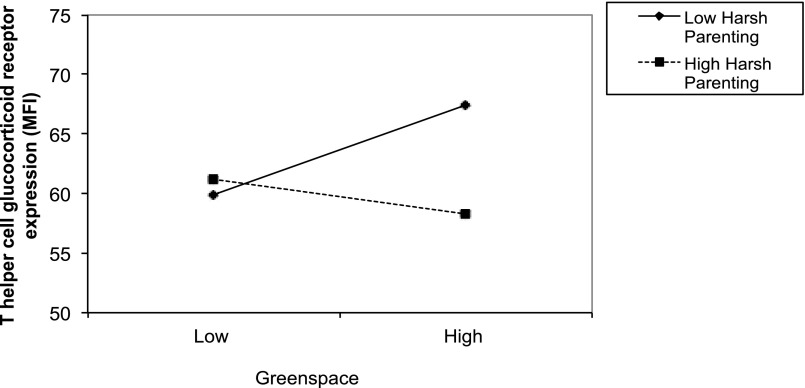
FIGURE 2.
Interaction of greenspace by harsh/inconsistent parenting predicting T-helper cell expression (CD3+CD4+) of GR protein, as measured by mean fluorescence intensity (MFI) in children. Graph reflects estimated regression lines drawn from −1 SD to +1 SD of the greenspace variable. Low and high on harsh/inconsistent parenting also refers to ±1 SD.

