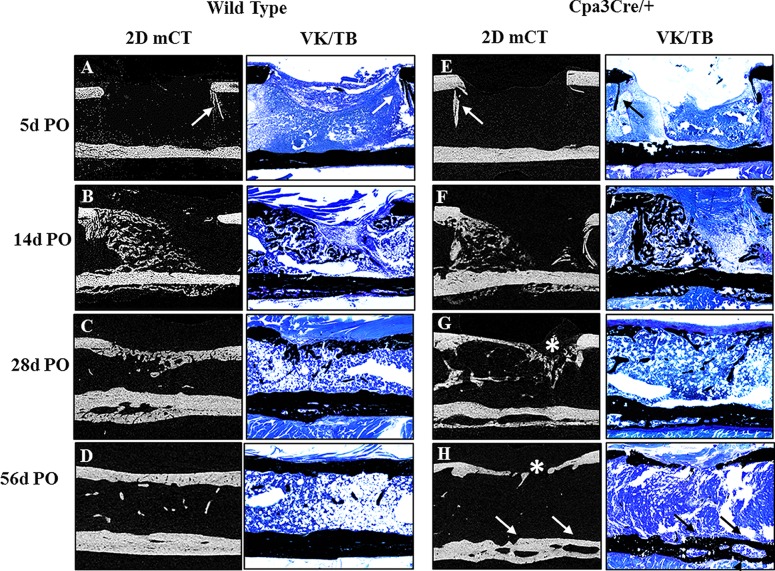
Fig 4. Macroscopic evaluation of bone repair over time.
2D micro CT images (A-H) were compared with 5 μm histological sections of un-decalcified bone stained with von Kossa and toluidine blue (VK/TB) to distinguish mineralised (black) from un-mineralized tissue (blue). Representative mid-sagittal images show shards of old bone (A, E arrows) remaining in the defect at 5d PO and significant new bone at 14d PO in the medullary canal and on the periosteal surface opposite the defect in both WT (B) and Cpa3Cre/+ (F) femora. At 28 days PO, the defect is bridged with primary bone in many WT (C), but not Cpa3Cre/+ (G asterix) mice. By 56d PO the majority of WT femora have assumed their pre-operative anatomy (D), whereas most of those from Cpa3Cre/+ mice exhibit mal-union on the defect side (H asterix) and large channels separating old from new bone on the contralateral cortex (H arrows). Images are representative of N = 7 WT and N = 6 Cpa3Cre/+ at 5d PO; N = 16 WT and N = 11 Cpa3Cre/+ at 14d PO; N = 8 WT and N = 10 Cpa3Cre/+ at 28d PO and N = 6 WT and N = 8 Cpa3Cre/+ at 56d PO.

