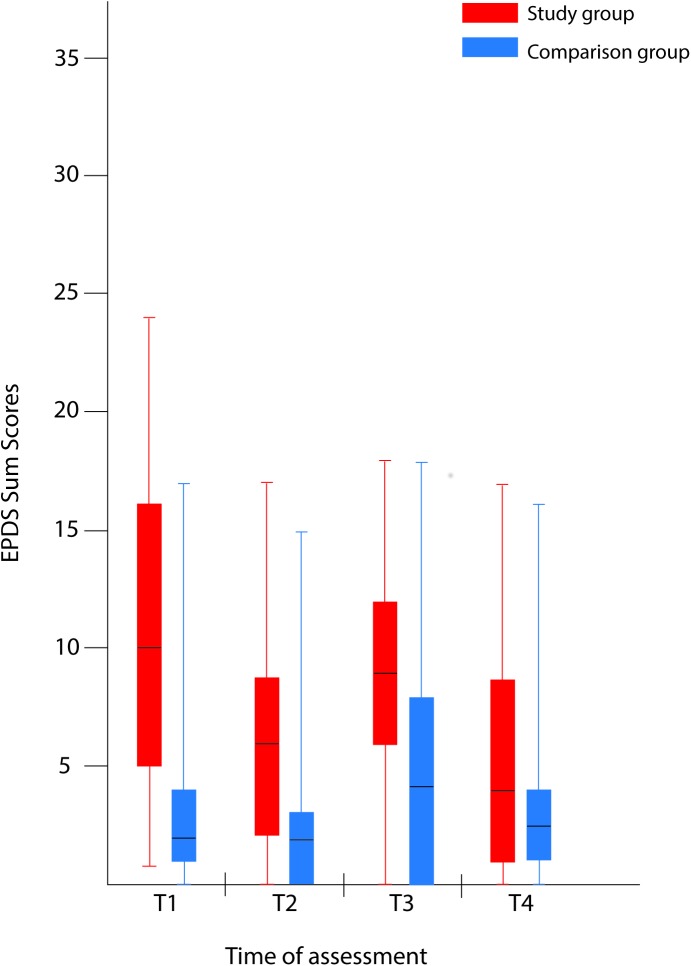
Fig 2. Comparison of maternal psychological distress during pregnancy with and without a fetal anomaly.
The figure presents psychological distress in women in the study group (with fetal anomaly) and comparison group (normal ultrasound findings) at the four assessments, as measured by the Edinburgh Postnatal Depression Scale (EPDS). Box-and-whiskers plots show 50% of cases (25–75 percentiles) in the rectangle, each of the whiskers represents the smallest and largest values. The line within the rectangle represents the median value.

