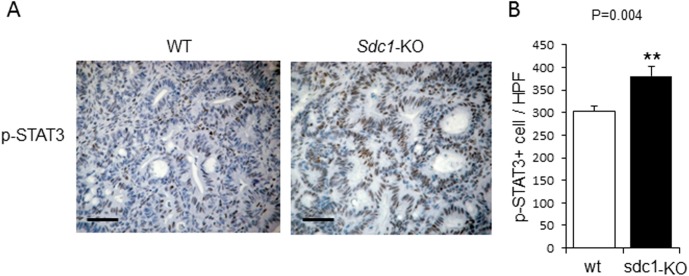
Fig 3. Increased activation of STAT3 in colonic tumors of Syndecan-1 KO mice compared to WT mice.
(A) Representative immunoreactive staining (brown) for phospho-STAT3 in AOM-DSS induced colonic tumors (day 61) of WT and Sdc1-KO mice. Scale bar, 100 μm. (B) Quantification of average numbers of phospho-STAT3 positive cells per high power field (X400) in ≥ 12 fields of each slide from 4 mice of each group. Error bars represent mean ± SE. **P < 0.01 by Student’s t test.

