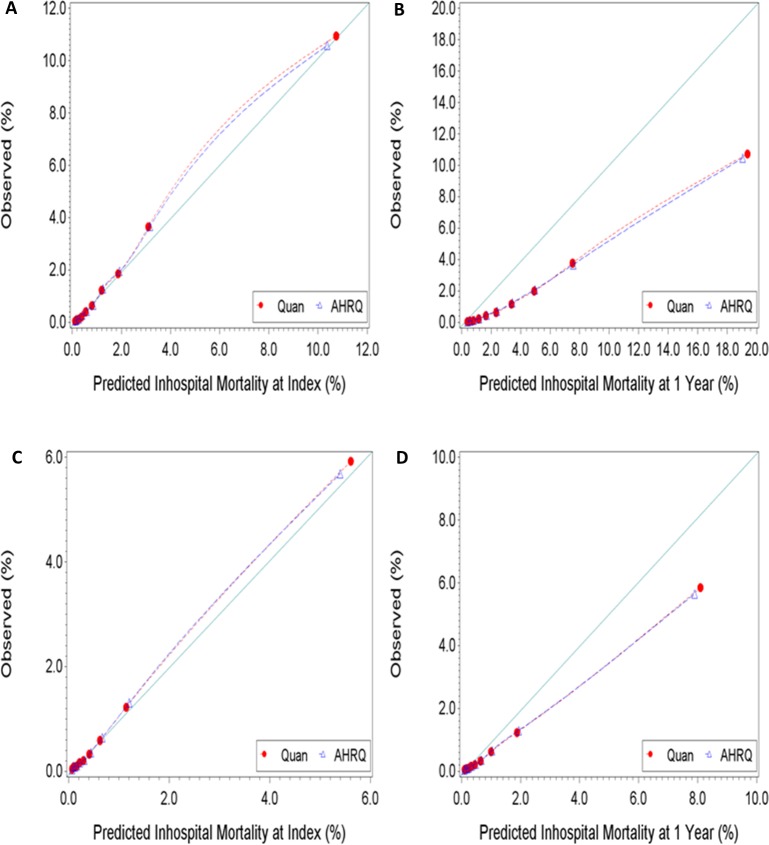
Fig 4.
Observed versus predicted risk of inhospital mortality at index [A] and at 1 year [B] for high risk patients, and inhospital mortality at index [C] and at 1 year [D] for low risk patients. Perfect calibration is represented by the full line with a slope of 1 starting at the origin. High risk patients had one or more inpatient stay in the 12 months preceding the index encounter or three or more emergency department visits in the 3 months preceding the index encounter. Patients that did not satisfy the high-risk criteria were assigned to the low risk group.

