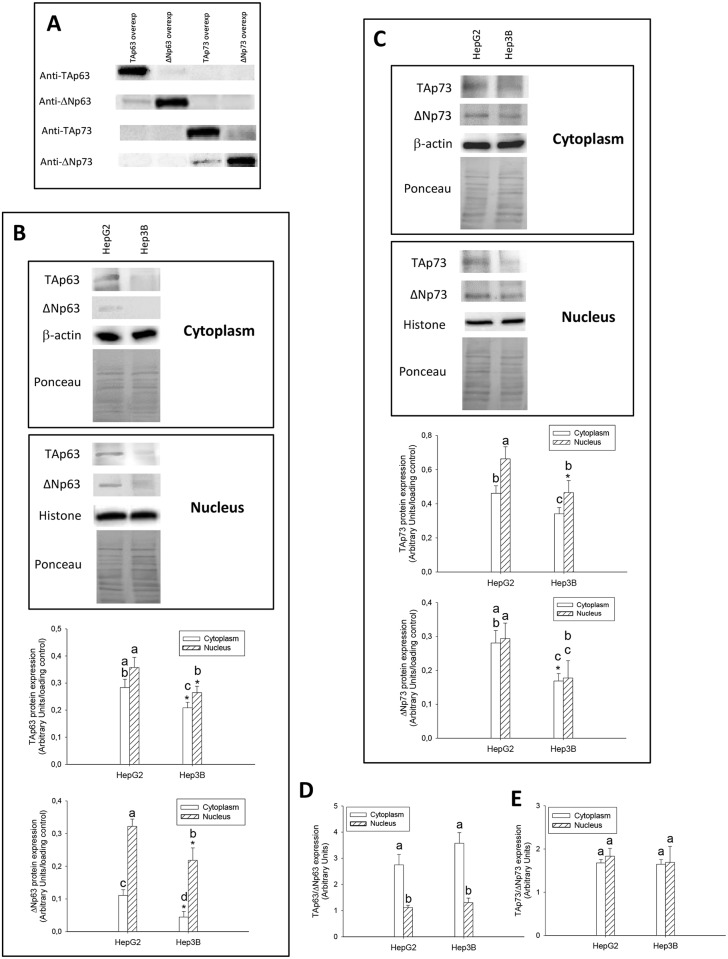
Fig 4. TAp63 and ΔNp63 (B), TAp73 and ΔNp73 (C) protein expression in cytoplasm and nuclear fractions, and their corresponding TAp63/ΔNp63 (D) and TAp73/ΔNp73 (E) protein ratio obtained from HepG2 and Hep3B cells.
The specificity of antibodies against the different TA and ΔN p63 and p73 isoforms was assessed by western-blot analysis in transfected HepG2 using TA and ΔN p63 and p73 overexpressing plasmids (A). The protein expression was assessed by western-blot analysis following the procedure described in Material and Methods. Data are expressed as mean ± SEM of the densitometry analysis referred to the corresponding loading control (β-actin and histone H3 in cytoplasm and nuclear fractions, respectively). The ponceau staining is also included (B and C). The asterisks indicate statistical significance compared with their corresponding control group (HepG2) (*p≤0.05). The groups with different letter (a, b, c or d) were significantly different among them (p≤0.05).

