
Figure 3.
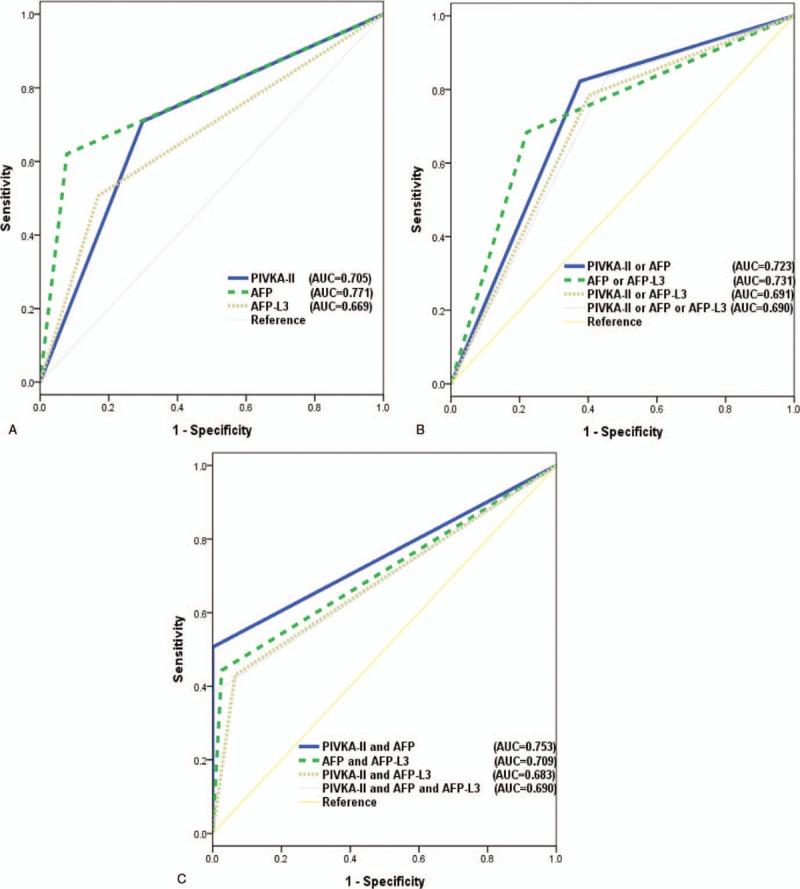
Comparisons of AUC values of the biomarkers for an AFP cut-off of 20 ng/mL. (A) AUC values of biomarkers individually (AFP vs AFP-L3; P = 0.005). (B) AUC values of combinations using “or” (no significant differences). (C) AUC values of combinations using “and” (“PIVKA-II and AFP” vs “PIVKA-II and AFP-L3”; P = 0.010; “PIVKA-II and AFP” vs “PIVKA-II and AFP and AFP-L3”; P < 0.001). AFP = alpha-fetoprotein, AUC = area under the curve, PIVKA-II = protein induced by vitamin K absence or antagonist-II.