
Figure 4.
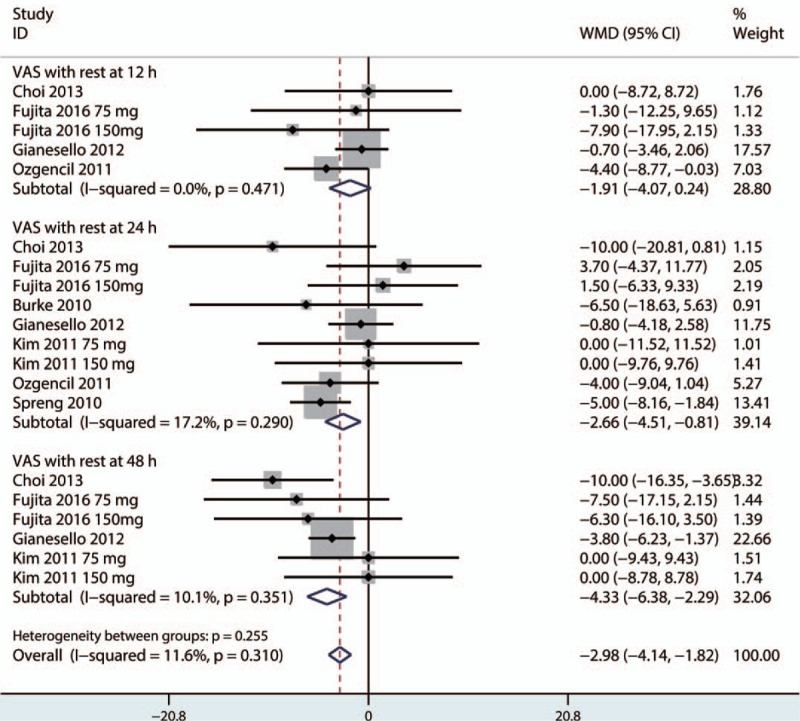
Forest plot comparing VAS scores with rest at 12 h, 24 h, and 48 h. VAS = visual analog scale.
Official websites use .gov
A
.gov website belongs to an official
government organization in the United States.
Secure .gov websites use HTTPS
A lock (
) or https:// means you've safely
connected to the .gov website. Share sensitive
information only on official, secure websites.
Forest plot comparing VAS scores with rest at 12 h, 24 h, and 48 h. VAS = visual analog scale.