
Figure 5.
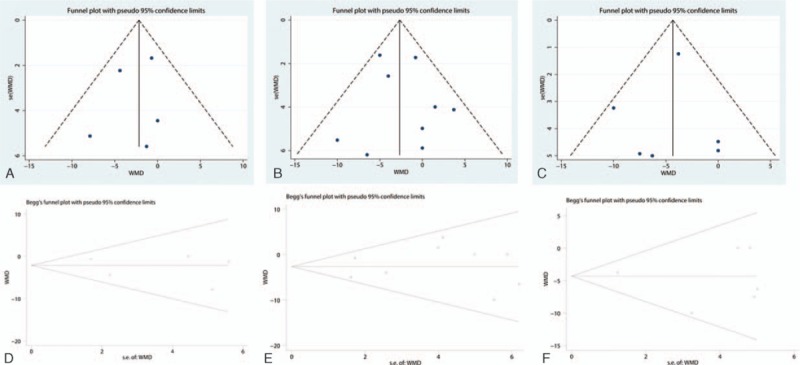
Funnel plot testing the publication bias of the VAS with rest at 12 h (A), 24 h (B), and 48 h (C) and Begg's test for VAS with rest at 12 h (D), 24 h (E), and 48 h (F). VAS = visual analog scale.
Official websites use .gov
A
.gov website belongs to an official
government organization in the United States.
Secure .gov websites use HTTPS
A lock (
) or https:// means you've safely
connected to the .gov website. Share sensitive
information only on official, secure websites.
Funnel plot testing the publication bias of the VAS with rest at 12 h (A), 24 h (B), and 48 h (C) and Begg's test for VAS with rest at 12 h (D), 24 h (E), and 48 h (F). VAS = visual analog scale.