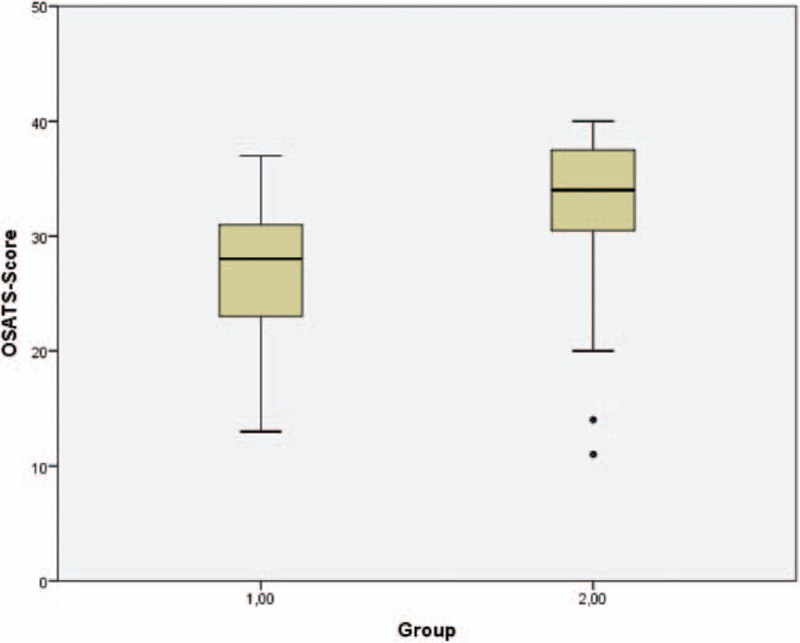
Figure 2.

Box plots with Objective Structured Assessment of Technical Skills (OSATS) scores in group 1 (demonstration) and group 2 (hands-on training), with the boxes representing 50% of cases and the whiskers representing 1.5× the interquartile range. Circles represent outliers.
