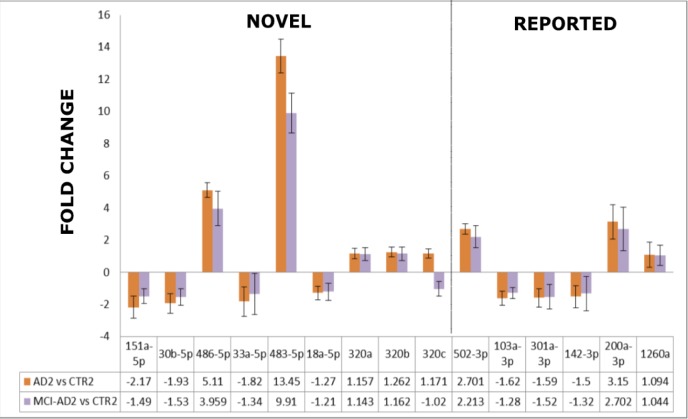
Figure 4. The comparison of the fold changes in the expression levels obtained by qRT-PCR in the verification experiment/Stage 2 for the 15-miRNAs which differentiated AD2 and MCI-AD2 patients versus non-demented controls CTR2.
9 miRNAs reported for the first time as AD biomarker candidates are indicated as a separate field of the plot. Means + SD are shown from triplicate experiments.

