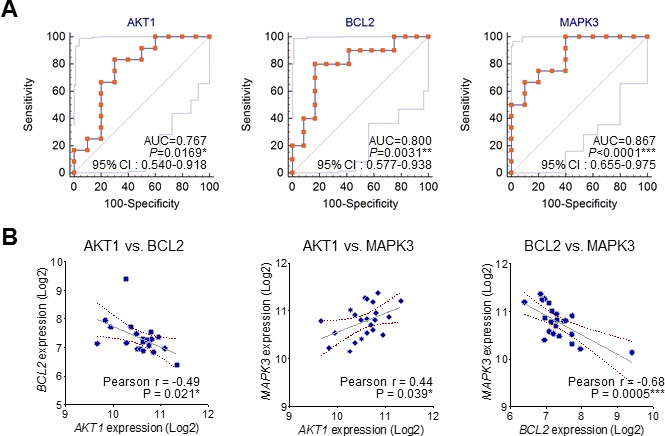
Figure 4. The ROC curve analysis and correlation of the three candidate molecular markers.

A. The receiver operating characteristic (ROC) curves for MAPK3, BCL2 and AKT1. (AUC: area under the curve; 95% C.I.: 95% confidence interval). B. The correlation between the expression of MAPK3, BCL2 and AKT1 in good and poor outcome groups.
