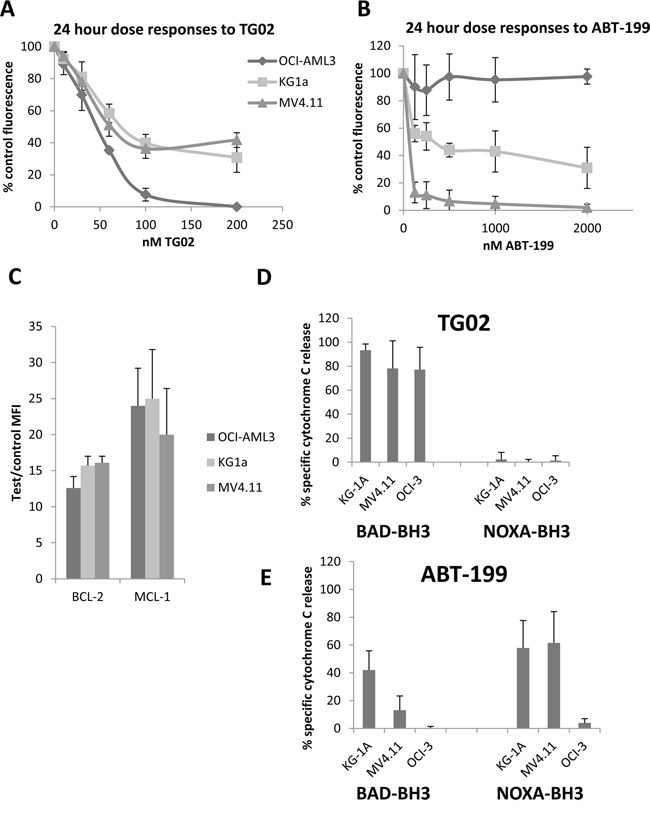
Figure 2. Responses to TG02 and ABT-199 and complementary BH3 profiles in KG-1a, OCI-AML3 and MV4.11 cell lines.

A-B. Cells were cultured at 5 X 10⁵/ml for 24 hours with the indicated concentrations of compounds and responses were measured by alamar blue assay. C. BCL-2, and MCL-1 were measured by flow cytometry. MFI = mean fluorescence intensity. D-E. Cells were treated for 4 hours with 100 nM TG02 or 500 nM ABT-199, permeabilised and treated for 1 hour with 23 μM NOXA-BH3 or with BAD-BH3 (0.3 μM in KG-1a and MV4.11, 3 μM in OCI-AML3) before fixation and labelling with Cytochrome C antibody for flow cytometry. The percentage of cells which had released cytochrome C, a measure of mitochondrial outer membrane permeabilisation, was measured on fluorochrome/side scatter dot plots. Adjustments for peptide-induced cytochrome C release in untreated cells were made by calculating agent-specific release according to the formula in the Methods section. All experimental results are mean ± SD of 3-4 independent assays.
