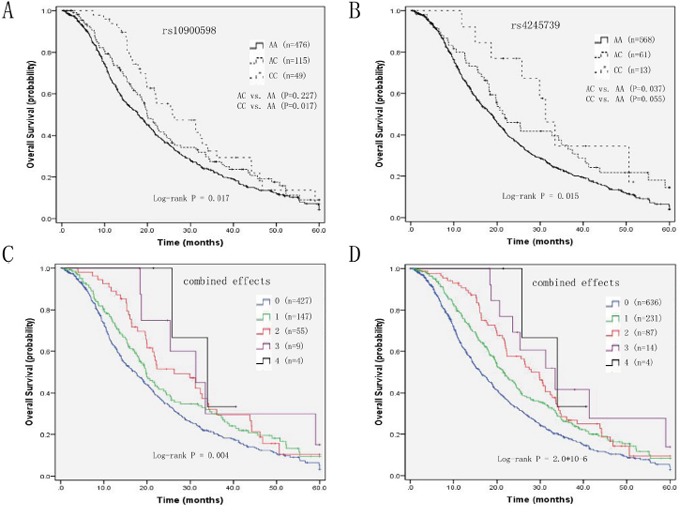
Figure 1. Kaplan-Meier curves of.

A. OS and rs10900598 in Discovery set, B. OS and rs4245739 in Discovery set, C. number of variant alleles from two SNPs in Discovery set, and D. number of variant alleles from two SNPs in Pooled populations.

A. OS and rs10900598 in Discovery set, B. OS and rs4245739 in Discovery set, C. number of variant alleles from two SNPs in Discovery set, and D. number of variant alleles from two SNPs in Pooled populations.