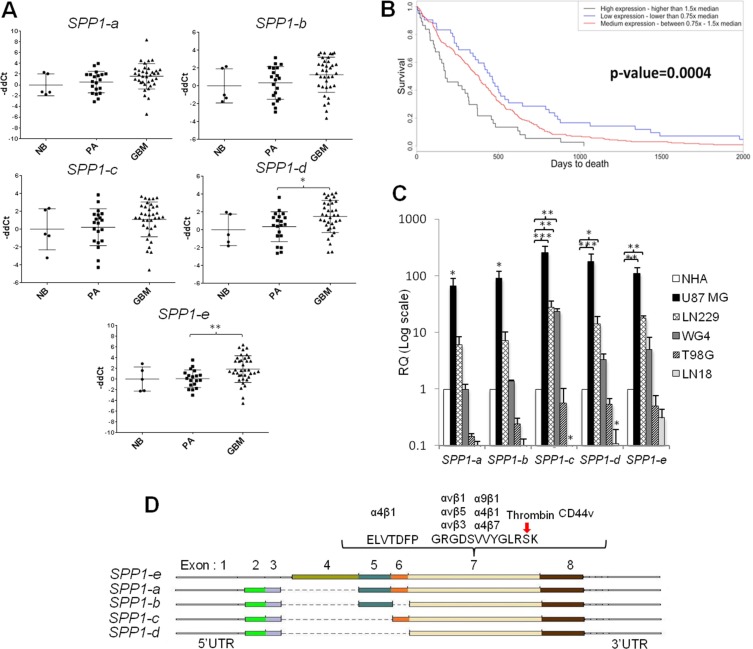
Figure 1. The expression pattern of SPP1 splicing variants in glioma clinical samples and human glioma cell lines.
(A) SPP1–e and SPP1-d isoform mRNAs are up-regulated in GBM. The expression level of five SPP1 isoforms was assessed in 36 glioblastoma (GBM), 20 pilocytic astrocytoma (PA) and 5 normal brains (NB) using qPCR. Data were normalized to the expression of GAPDH mRNA determined in the same sample. T-test analysis was performed on -ddCt results, P values were considered significant when *P ≤ 0.05 and **P ≤ 0.01. (B) Prognostic value of the SPP1 expression in GBMs (WHO grade IV) in the TCGA cohort. Kaplan-Meier plots were estimated according to different SPP1 gene expression and overall survival of all GBM patients (n = 359). A chi-square test was used to evaluate differences in survival of patients with SPP1 expression lower or higher than median. (C) Relative expression of SPP1 splicing variants in human glioma cell lines versus non-transformed astrocytes. Human T98G, LN18, LN229, U87 MG, GBM patient derived WG4 glioma cells, and normal human astrocytes (NHA, Lonza) were used. Data were normalized to the expression of GAPDH mRNA and represent mean ± s.d., of three independent passages. T-test analysis was performed on -ddCt results, P values were considered significant when *P ≤ 0.05, **P ≤ 0.01 and *** for P ≤ 0.001. (D) A scheme shows the organisation of the SPP1 gene in different isoforms and location of the most important functional domains.

