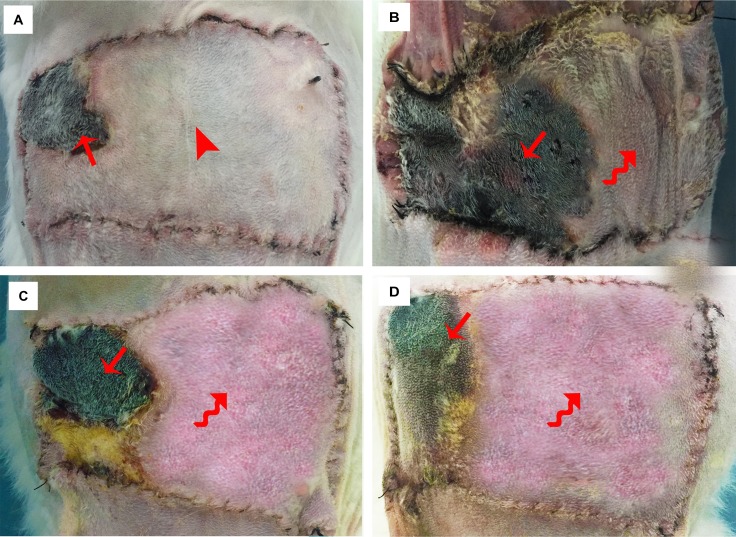
Figure 2. Flap survival status 14 days after surgery.
(A) Control group: a small area of flap loss presented around the contralateral corner of the flap with no obvious swelling or venous congestion.(The arrow head shows the area without obvious swelling and venous congestion and the straight arrow indicates the small necrosed area). (B) Experimental group I: more than half of the flap was necrosed with swelling and venous congestion around the necrosed area. (The curved arrow shows the area with obvious swelling and venous congestion and the straight arrow indicates the necrosed area). (C) Experimental group II: partial flap loss was noted in the distal part of the flap with swelling and venous congestion around the necrosed area. (The curved arrow shows the area with significant swelling and venous congestion and the straight arrow indicates the necrosed area). (D) Experimental group III: partial flap loss was noted in the distal part of the flap with swelling and venous congestion around the necrosed area. (The curved arrow shows the area with significant swelling and venous congestion and the straight arrow indicates the necrosed area)

