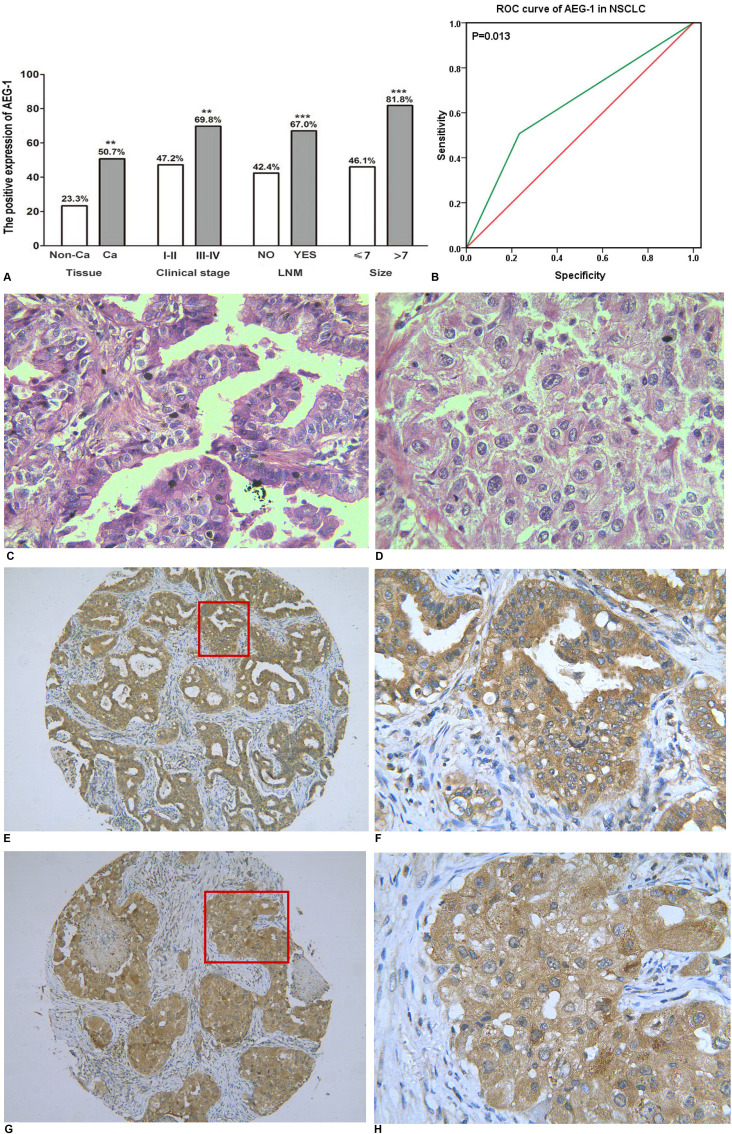
Figure 1. The relationship between AEG-1 expression and NSCLC.
(A) The differential expression of AEG-1 between lung cancer and normal lung tissues, and the correlation between AEG-1 expression and clinical stage, LNM and tumor size (**P < 0.01, ***P < 0.001). Note: LNM: lymph node metastasis. (B) ROC curve analyses of AEG-1 for predicting the clinical diagnostic value in NSCLC. The area under curve (AUC) of AEG-1 was 0.637 (95% CI 0.540–0.734, P = 0.013), which indicates a potential diagnostic value of AEG-1 level in NSCLC. (C) Hematoxylin/eosin (HE) staining of lung adenocarcinoma tissues with AEG-1 expression (x 400). (D) Hematoxylin/eosin (HE) staining of squamous cell carcinoma with AEG-1 expression (× 400). (E) Immunohistochemical staining for AEG-1 in lung adenocarcinoma (× 100). (F) Immunohistochemical staining for AEG-1 in lung adenocarcinoma (× 400). (G) Immunohistochemical staining for AEG-1 in squamous cell carcinoma (× 100). (H) Immunohistochemical staining for AEG-1 in squamous cell carcinoma (× 400).

