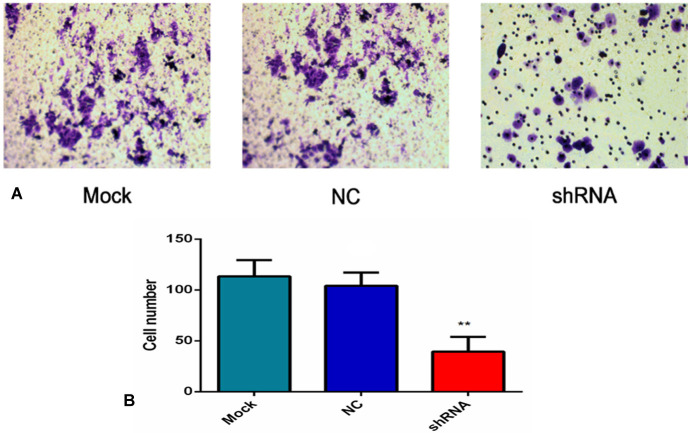
Figure 11. AEG-1-shRNA inhibited the invasion of the H460 cells.
(A) Transwell invasion assay was performed to explore whether the expression of AEG-1 affected cell invasion, and the least number of the migratory cells was found in the shRNA group. (P < 0.01). (B) The number of invasive cells in the mock, NC and AEG-1-shRNA groups were counted. The graph represents the Mean ±SD. (**P < 0.01).

